Figure 6.

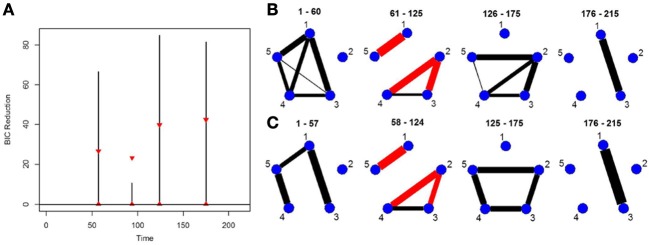
(A) The splitting times plotted against BIC reduction for the VAR data set (simulation 6) using the new DCR. The corresponding (B) true undirected graphs and (C) estimated undirected graphs for this data set.

(A) The splitting times plotted against BIC reduction for the VAR data set (simulation 6) using the new DCR. The corresponding (B) true undirected graphs and (C) estimated undirected graphs for this data set.