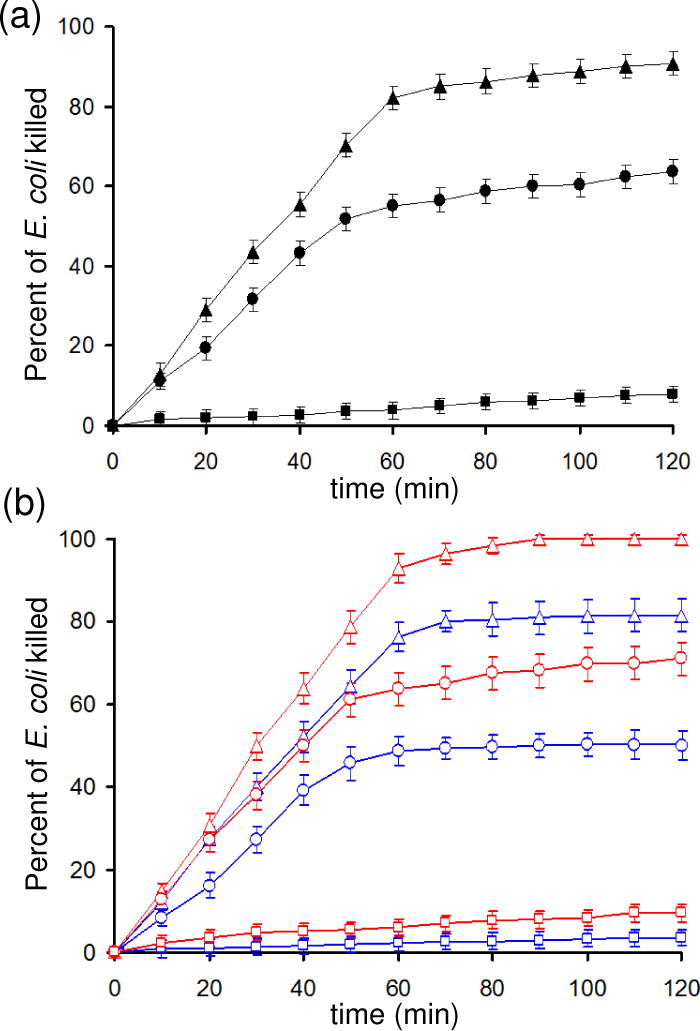
Figure 3.

Experimental relationship of E. coli inactivation by the singlet oxygen bubble treatment: (a) in buffer solution (30 μg/mL E. coli in 33 mM Tris-HCl buffer) as a function of pre-equilibration with nitrogen (▲), air (●), or oxygen (■); and (b) blue symbols, SDS buffer (30 μg/mL E. coli in Tris-HCl buffer with sodium dodecyl sulfate (1.0 mM)), and red symbols, CaCl2 buffer (30 μg/mL E. coli in Tris-HCl buffer with 1 mM Ca2+ added), after first being pre-equilibrated with nitrogen (
 ,
,
 ), air, (
 ,
,
 ) or oxygen (
 ,
,
 ). Error bars were obtained from 3 or more measurements.
