
Figure 5.
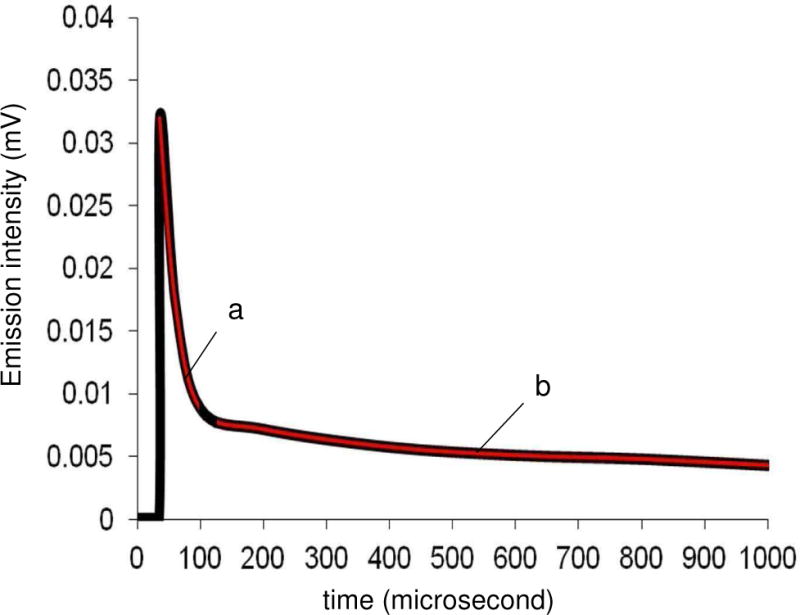
Singlet oxygen decay curves in air pre-saturated H2O: (a) fast decay component attributed to solvated singlet oxygen, and (b) slow decay component attributed to singlet oxygen within the interior of the gas bubble. Experimental data (black line) and fitting (red line) are shown.