
Figure 1. NHEJ mediated repair of a chromosomal I-SceI induced DSB with incompatible ends.
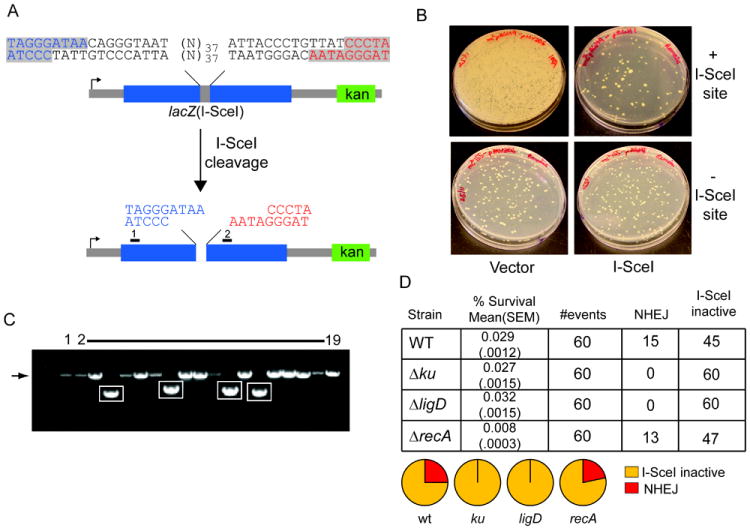
A. Schematic representation of double site I-SceI DSB substrate. Two I-SceI sites in opposite orientation produce a DSB with incompatible 3’overhangs, with the two halves of the DSB colored blue and red. The positions of primers 1 and 2, used to amplify and sequence repaired DSBs after I-SceI cleavage, are indicated by black rectangles. A kanamycin marker (green box) is 3’ of the break.
B. The I-SceI substrate pictured in (A), or a control substrate lacking the I-SceI sites, was integrated into the chromosome of M. smegmatis (see materials and methods). These strains were transformed with a plasmid conferring hygromycin resistance and directing the expression of I-SceI endonuclease (I-SceI) or vector. Shown are M. smegmatis colonies on agar plates containing hygromycin. Substantial cell death is evident in the strain with I-SceI sites transformed with I-SceI plasmid (upper right) but not in cells transformed with control plasmid (upper left), or in a strain lacking a chromosomal I-SceI cutting site (lower panels). All the cells from the entire transformation mixture (1.4 ml) were plated for the strain with chromosomal I-SceI sites (upper panels), whereas 100 μl of the transformation mixtures were plated in case of the strain lacking I-SceI sites (bottom panels).
C. Clonal repair events from 18 surviving colonies after I-SceI expression were analyzed by PCR amplification using primers 1 and 2. PCR products were separated on a non-denaturing agarose gel and visualized by ethidium bromide staining in comparison to the PCR product generated from amplification of the parent construct that had not undergone I-SceI cleavage (lane 1). The expected size of the PCR product from primers 1 and 2 (1350 bp) is indicated by an arrow to the left of the gel image, and amplicons showing deletion formation after DSB repair are boxed.
D. Repair of incompatible 3’ overhangs depends on NHEJ. The I-SceI substrate pictured in (A) was integrated into the chromosome of wild type (as in B), Δku, ΔligD and ΔrecA strains. The table shows % survival obtained after transformation with I-SceI plasmid ((mean value obtained from three experiments is shown with standard error of the mean, SEM, indicated in parentheses) and NHEJ outcomes were scored from 60 transformants, from one experiment. The pie graphs represent the fraction of each repair outcome among total survivors. I-SceI inactive refers to survivors that had inactivated the I-SceI cDNA by mutation and had unmodified I-SceI cleavage sites in the chromosome.