
Figure 2. Molecular outcomes of NHEJ.
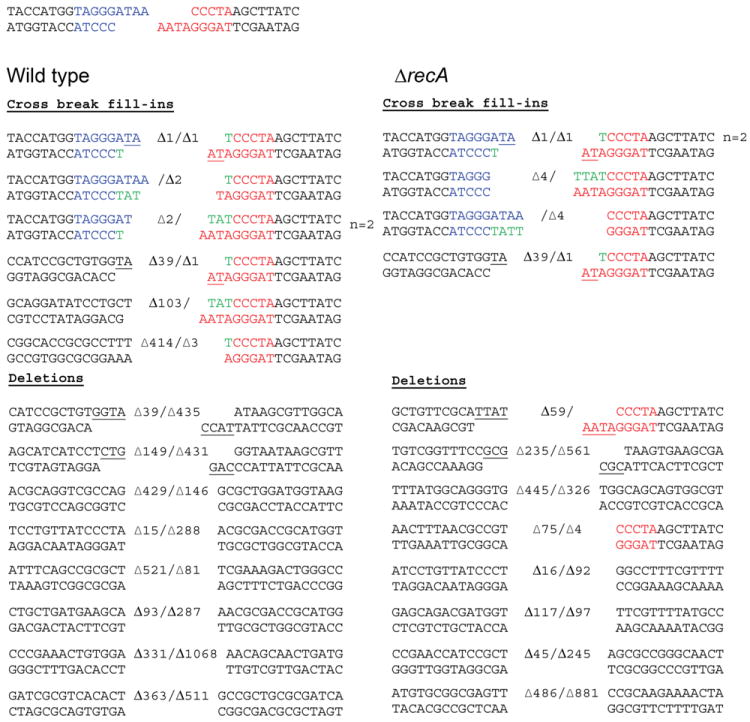
The cut I-SceI site is shown at the top of the figure with left and right ends colored blue and red respectively. Molecular outcomes from WT (n=15, left panel) and ΔrecA strain (n=13, right panel) carrying the NHEJ substrate pictured in Figure 1A are shown with the number of deleted nucleotides indicated. Nucleotides added by fill-in synthesis of the 5’ recessed ends are colored green and microhomology use is underlined.