
Figure 6. Relative contributions of RecBCD and AdnAB to clastogen resistance.
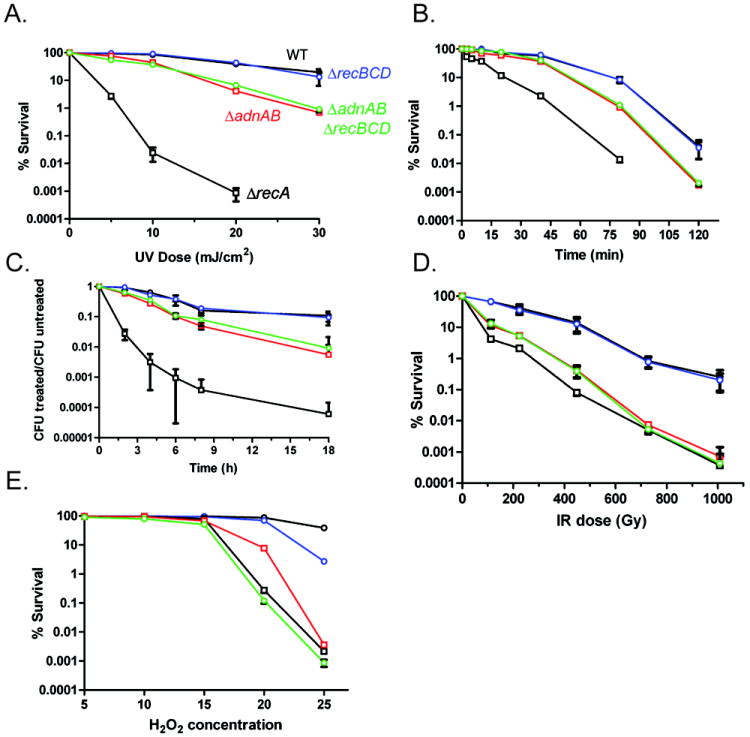
For each panel, % survival was determined by culturing serial tenfold dilutions on agar plates after exposure to the indicated dose of clastogen. Each graphed point represents the mean of biologic triplicates and % survival is graphed on a logarithmic Y axis. For all panels, strains are indicated in panel A by different colors (also see below). For all panels, error bars are SEM and when not visible are within the symbol.
A. UV radiation. Strains tested: WT (mc2155; black color with open circles), ΔrecBCD (mgm177; blue color), ΔadnAB (mgm1964; red color), ΔadnABΔrecBCD (mgm1965; green color), and ΔrecA (mgm199; black color with open squares).
B. 0.5 % MMS for the indicated time.
C. 25 ng ml-1 mitomycin C for the indicated time.
D. Ionizing radiation delivered by a cesium source.
E. Hydrogen peroxide.