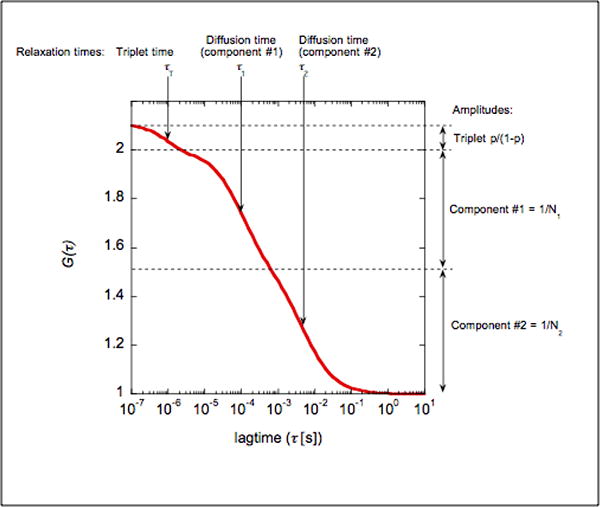
Figure 3. typical FCS curve and relevant parameters.

We present here the theoretical curve for the FCS measurement on a mixture of two species (component #1 and #2): Diffusion times are τ1=100μs and τ2=10ms, with N1=2 and N2=2 particles/confocal volume. The dye has a triplet time τT of 1μs and a triplet fraction at 10% (p=0.1). Note how the two diffusion times yield two relaxations that can hardly be separated.
