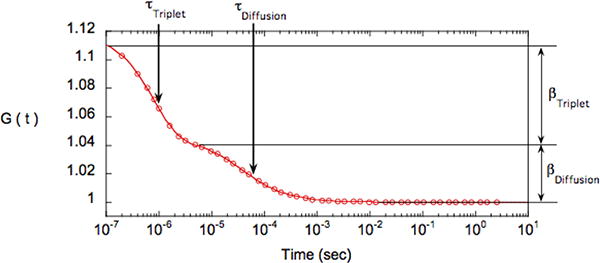
Figure 5.

autocorrelation function (circle) and associated fit (continuous line) for a solution of FITC-labeled IgG. The fit corresponds to a single component 2D- diffusion with a triplet relaxation -equation (5). The two relaxations can easily be distinguished: the first one is associated with diffusion (τDiffusion=40μs) and the second one with triplet relaxation (τTriplet=0.8s). Their respective amplitude are βDiffusion=0.045 (hence there are 1/βDiffusion=22 fluorescent objects per confocal volume) and βTriplet=0.074 (hence pTriplet=0.62 as βTriplet= βDiffusion*(pTriplet/(1-pTriplet) or pTriplet=βTriplet/(βDiffusion+βTriplet)
