
Fig. 4.
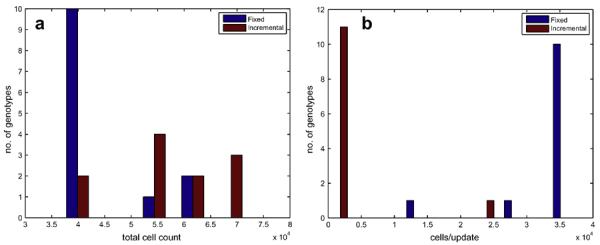
(a) The total cell count when the tissue has reached homeostasis and (b) the cell turnover rate during homeostasis. The general trend is that genotypes from the fixed scheme has a lower total cell count, but a higher cell turnover rate compared to the genotypes evolved in the incremental scheme.