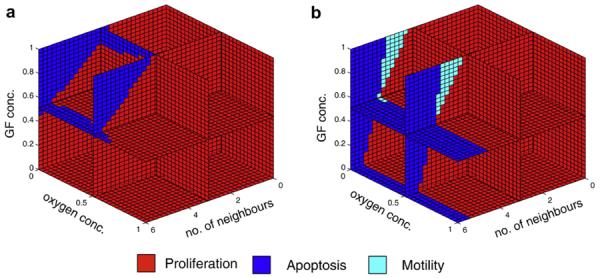
Fig. 7.

The behaviour of two network architectures (genotypes), one from each class (fixed and incremental), visualised by mapping each point in the micro-environmental input space to the associated behaviour determined by the response network. Here proliferation is shown in red, apoptosis in blue, and motility in cyan.
