
Figure 6.
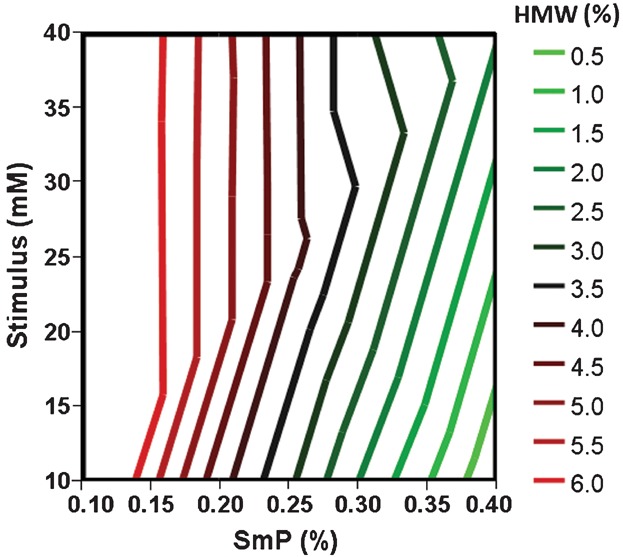
A contour plot analyzing the effect of SmP E dose and stimulus concentration on HMW reduction in the Mab-I/SmP E flocculation central composite design study.
Official websites use .gov
A
.gov website belongs to an official
government organization in the United States.
Secure .gov websites use HTTPS
A lock (
) or https:// means you've safely
connected to the .gov website. Share sensitive
information only on official, secure websites.
A contour plot analyzing the effect of SmP E dose and stimulus concentration on HMW reduction in the Mab-I/SmP E flocculation central composite design study.