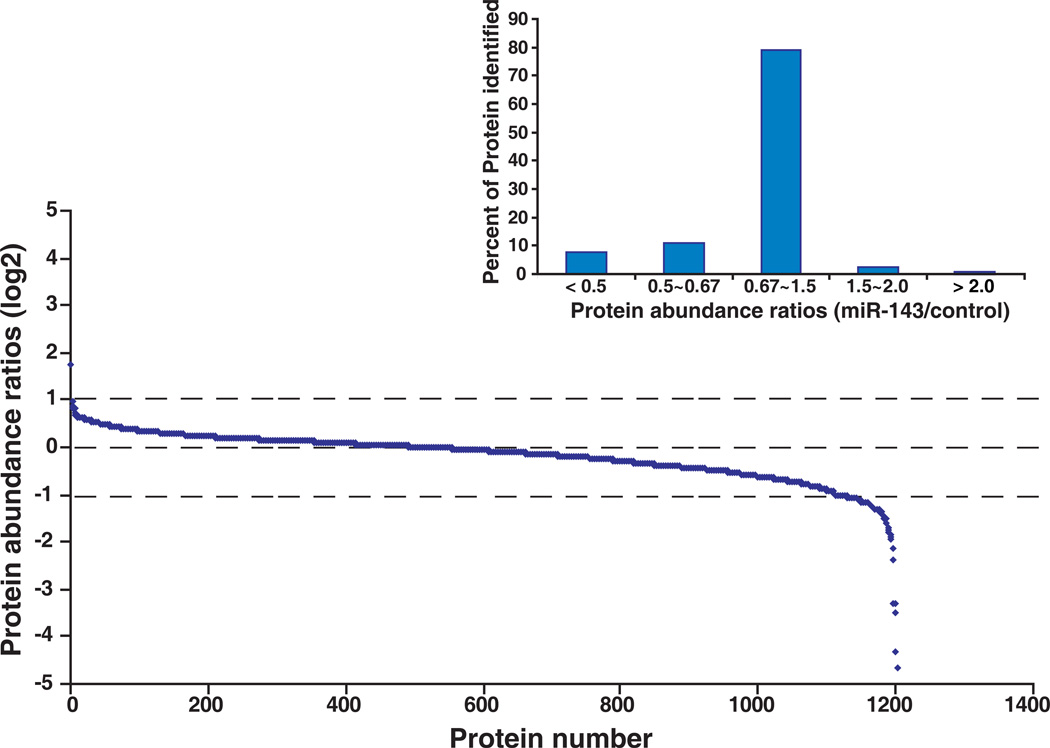
Figure 2. Ratio distribution of all quantitated proteins.
In total, 1,202 proteins were identified and quantitated using the SILAC-based proteomic approach. Relative changes of identified proteins are demonstrated by the ratio of intensity from miR-143 transfected sample to control oligo transfected sample. The distribution of the protein ratio is illustrated and the right insert shows percent of proteins with different ratio ranges.

