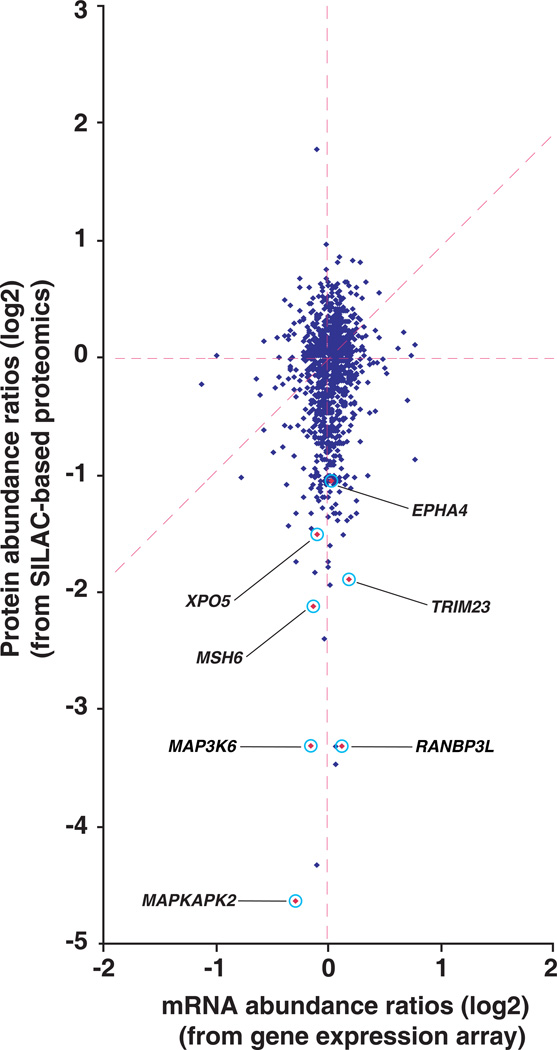
Figure 4. Comparison of proteome and transcriptome.
The dataset containing 1,117 genes, which have quantitative data at both protein and mRNA levels was used to generate a scatter plot of the protein ratios (miR-143 mimic/control oligo) versus mRNA ratios (miR-143 mimic/control oligo) are shown. Select interesting molecules MAPKAP kinase 2 (MAPKAPK2), mitogen-activated protein kinase kinase kinase 6 (MAP3K6), RAN binding protein 3-like (RANBP3L), MutS homolog 6 (MSH6), Tripartite motif-containing 23 (TRIM23), exportin 5 (XPO5) and ephrin receptor EphA4 (EPHA4) are highlighted in the figure.

