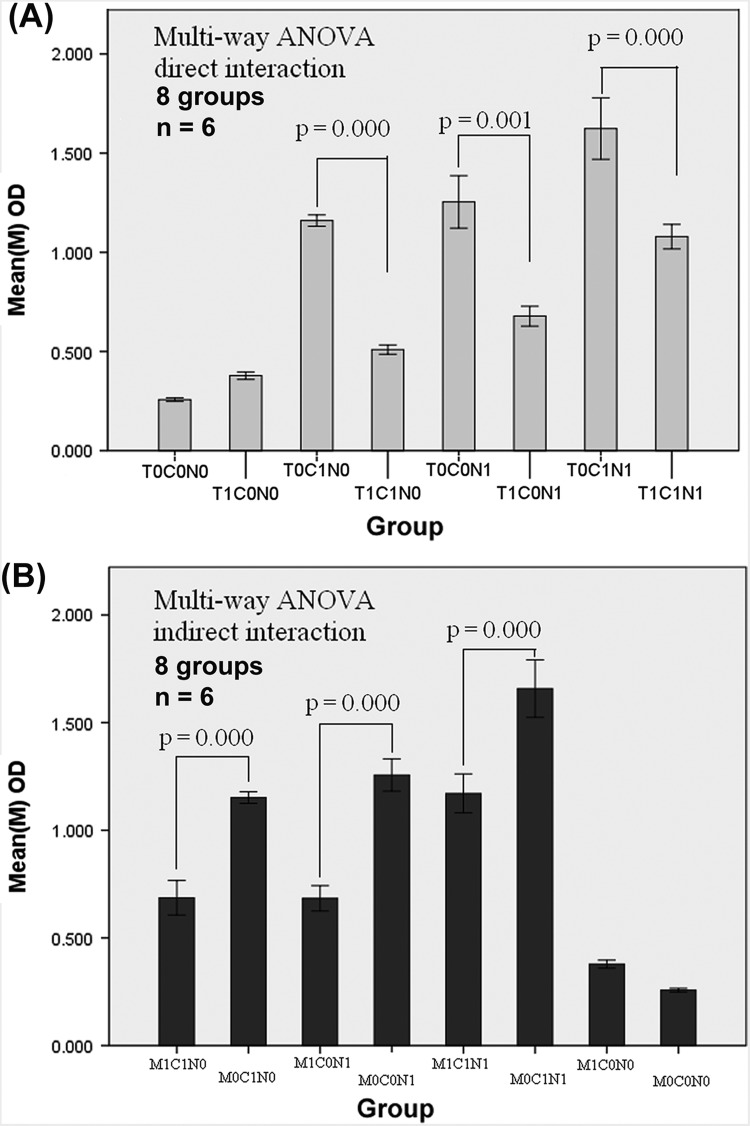
Figure 4.
Box diagram of the factorial design. A): The direct interaction of homologous TILs/CAFs/NFs (3 factor × 2 level, 8 groups, n = 6). The factors comprised T: TILs. C: CAFs and N: NFs. Level 0, 1 indicate the given number of cells. N0/C0/T0 meant 0 cell/well; N1/C1 meant 1500 cells/well; T1: 15 000 cells/well. Multi-way ANOVA showed significant differences existing between the two groups of T0C1N0/T1C1N0, T0C1N1/T1C1N1, and T0C0N1/T1C0N1. B): The indirect interaction of homologous TILs/CAFs/NFs. Factor M represents the medium. M indicates TILs in the upper chamber of the Transwell plates (0.4 μm), influenced CAFs/NFs indirectly. C/N meant 1500 cells/well, and M0/M1 meant 0 and 15 000 cells/well in an up chamber. Multi-way ANOVA also showed significant differences in the group-group comparison (p = 0.00).

