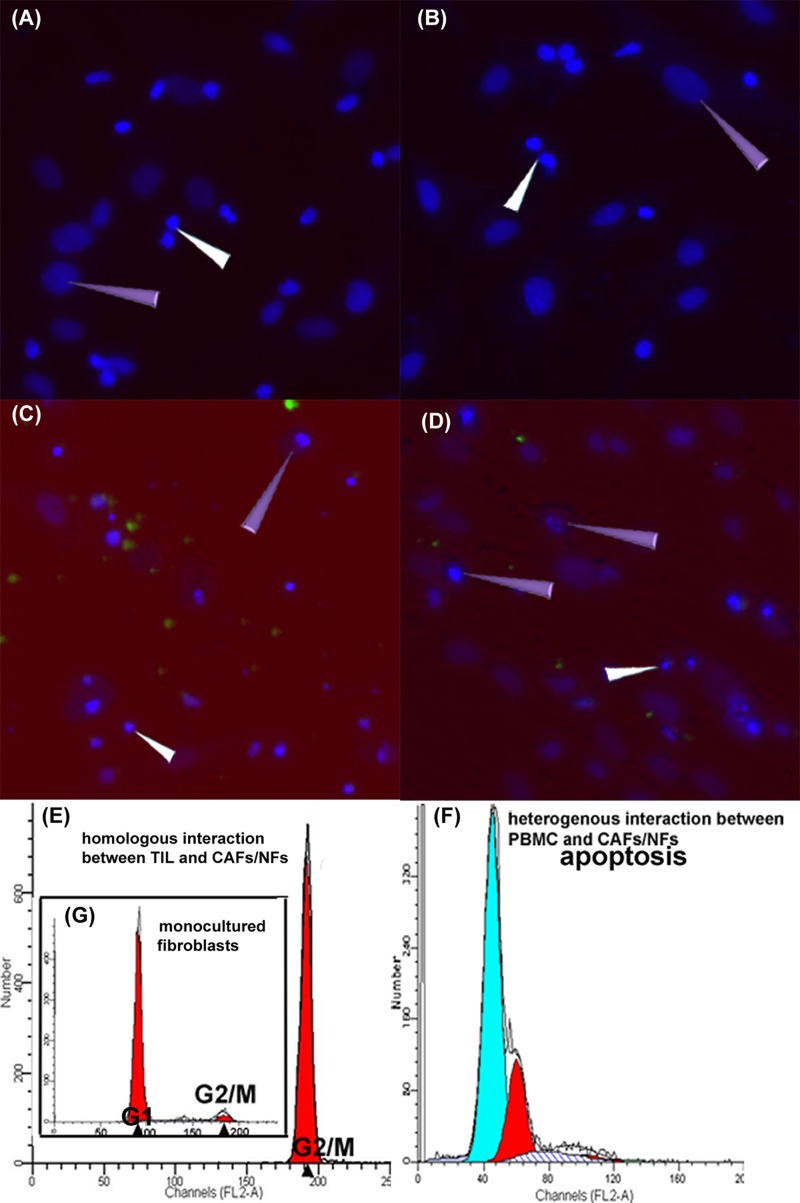
Figure 5.
Fate of CAFs/NFs in the co-culture system. 1): A/B showed the co-culture of homologous TILs/CAFs (A) and TILs/NFs (B) for 120 hours. The results show no signs of apoptosis or death in the CAFs/NFs (purple triangle). C/D showed the co-culture of heterologous TILs and CAFs (C)/NFs (D) for 24 hours. The results show some fibroblasts with nuclear condensation and fragmentation (purple triangle). White triangles indicate the TILs. The nuclei were stained by DAPI (blue) and TILs (C/D) were labeled with CFDA-SE (green). A, B, C, D 200-fold. 2): The representative figures (E/F/G) of cell cycle and apoptosis illustrate the fate of CAFs/NFs co-cultured with TILs (120 hours) and PBMC (24 hours). E demonstrates that almost all of the CAFs and NFs were arrested in the G2/M phase when co-cultured with homologous TILs. F is the positive control, displaying CAFs/NFs apoptosis when co-cultured with heterologous PBMC. G, as a normal control, is the cell cycle of mono-cultured fibroblasts.

