
FIG 3 .
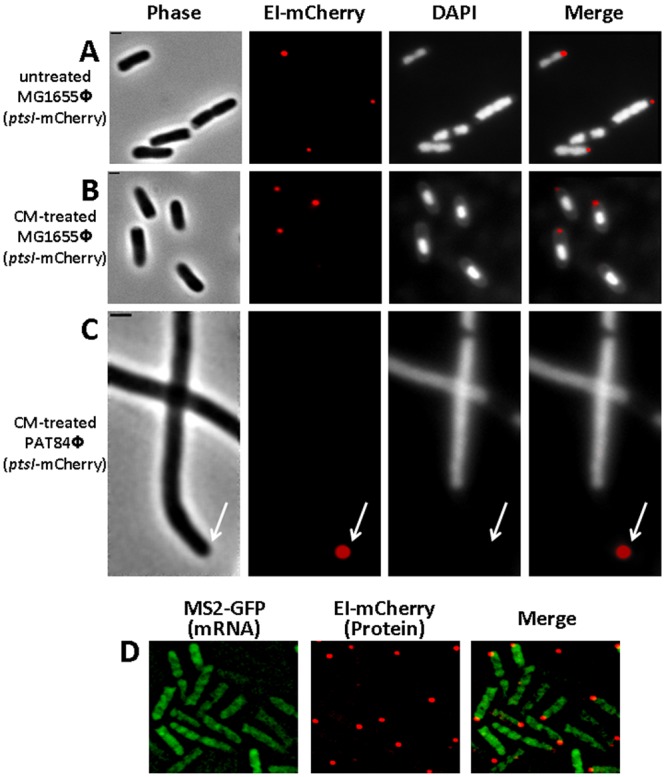
Nucleoid occlusion and localized translation do not account for EI polar localization. (A to C) Images showing EI-mCherry distribution in MG1655Φ(ptsI-mCherry) wild-type E. coli cells untreated (A) or treated with 150 µg/ml chloramphenicol for 20 min (B) and in PAT84Φ(ptsI-mCherry) ftsZ844ts mutant cells that were shifted to the nonpermissive temperature (42°C) and treated with 150 µg/ml chloramphenicol for 20 min. The cells were observed with phase microscopy (gray), the mCherry fusion protein was observed by fluorescence microscopy (red), and DNA staining was with DAPI (white). (D) Fluorescence microscopy images of cells expressing the MS2-GFP protein (green) and an EI-mCherry fusion (red), whose encoding RNA transcripts are tagged with six repeats of the MS2-binding sites. Overlays of the fluorescent signals in panels A to D are also shown (merge). The arrow indicates the pole region. The scale bar corresponds to 1 µm.