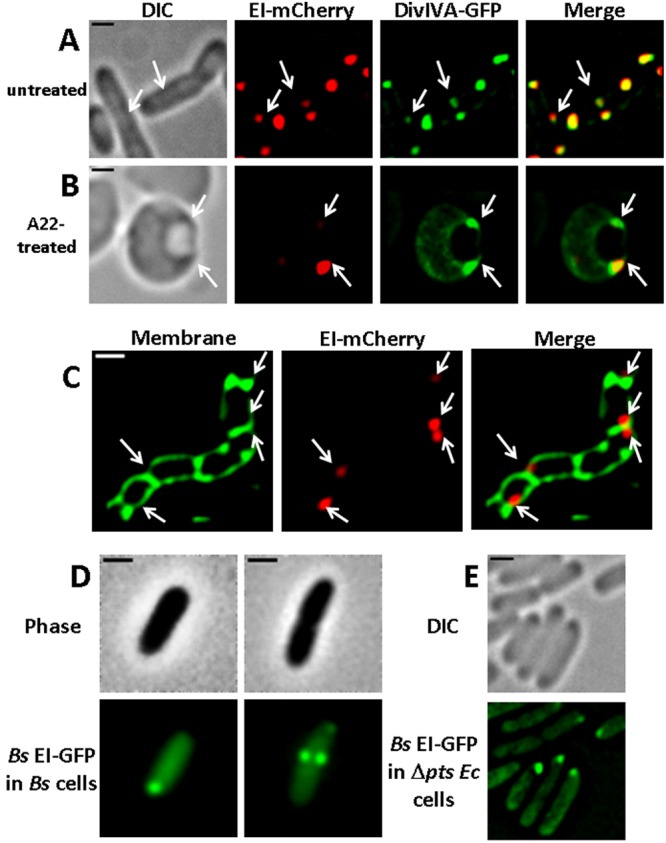
FIG 5 .

The E. coli EI protein and the B. subtilis DivIVA and EI proteins show similar localization patterns. (A and B) Images showing the distribution pattern of the E. coli EI protein fused to mCherry and the B. subtilis DivIVA protein fused to GFP in wild-type E. coli cells untreated (A) or treated with A22 (B). (C) Images showing EI-mCherry in MHD63, a murein hydrolase E. coli mutant. (D and E) Images showing the distribution pattern of the B. subtilis EI protein fused to GFP in wild-type B. subtilis (Bs) cells (D) and in ∆pts E. coli (Ec) cells (E). The cells were observed with phase microscopy or DIC (gray), and the mCherry and GFP fusion proteins were observed by fluorescence microscopy (red and green, respectively). Overlays of the fluorescent signals in panels A to C are also shown (merge). Arrows indicate negatively curved regions. The scale bar corresponds to 1 µm.
