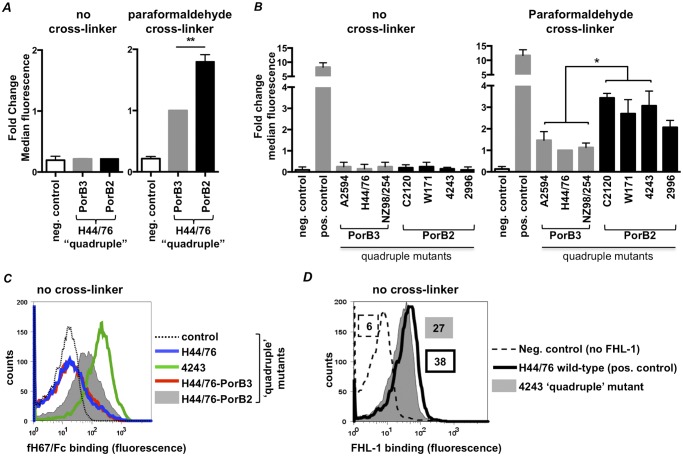
FIG 4 .
PorB2 binds full-length fH, fH domains 6 and 7, and FHL-1. (A and B) Binding of human fH to quadruple mutants of H44/76 that express either PorB344/76 (H44/76-PorB3) or PorB24243 (H44/76-PorB2) (A) and quadruple mutants of N. meningitidis strains that express either PorB3 (A2594, H44/76, and NZ98/254) or PorB2 (C2120, W171, 4243, and 2996) (B). Quadruple mutants were incubated with purified fH (100 µg/ml), and bound fH was measured by FACS analysis (graphs labeled “no cross-linker”). In some experiments, bound fH was cross-linked to the surface with paraformaldehyde (final concentration, 1% [vol/vol]) prior to detection by FACS analysis (graphs labeled “paraformaldehyde cross-linker”). The negative control (control) was a reaction mixture that lacked fH (neg. control). Binding of fH to wild-type H44/76 that expresses fHbp, NspA, capsule, and LOS sialic acid is shown as a positive control in panel B (pos. control). The amount of bound fH is represented on the y axis as fold change in median fluorescence relative to the H44/76 quadruple mutant that expresses PorB3 (in panel A) or the H44/76 quadruple mutant (in panel B) with paraformaldehyde cross-linker. Each bar represents the SEM of the results of 2 to 3 independent experiments (note that some error bars are small and are not easily seen on the figure). **, P < 0.01; *, P < 0.05 (1-way ANOVA with Tukey’s posttest for pairwise comparisons). (C) PorB24243 binds to fH67/Fc. Binding of human fH67/Fc to quadruple mutants of H44/76 (blue line), 4243 (green line), and H44/76 that express either PorB344/76 (H44/76-PorB3; red line) or PorB24243 (H44/76-PorB2; gray shading) was measured by FACS analysis. The negative control (broken line) was a reaction mixture that lacked fH67/Fc. x axis, fluorescence on a log10 scale; y axis, counts. Data from an experiment representative of at least two reproducible repeats are shown. (D) A quadruple mutant of strain 4243 binds FHL-1. Binding of FHL-1 (10 µg/ml) to the 4243 quadruple mutant (gray-shaded histogram) was measured by FACS analysis using polyclonal goat anti-human fH. FHL-1 was omitted in the negative control (broken line). The positive control shows binding of FHL-1 to wild-type H44/76 (solid black line). Numbers alongside histograms represent the median fluorescence, and the fill/outline corresponds to that of the histograms.

