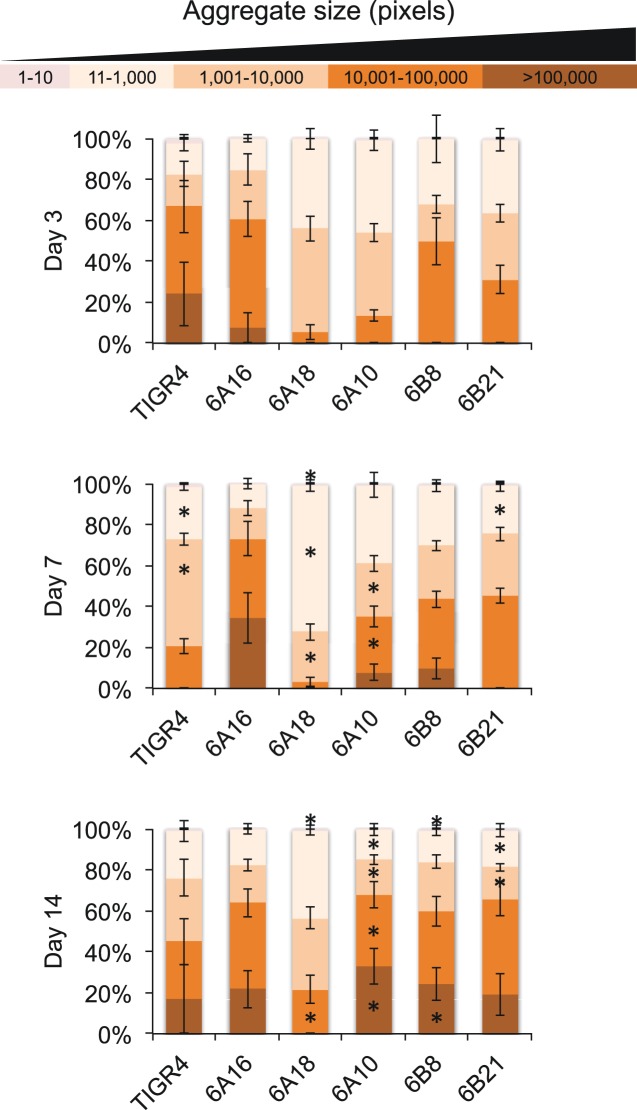
FIG 3 .
In vivo aggregates detected in NALF of mice colonized with S. pneumoniae. Following processing with ImageJ software (see Materials and Methods), individual biofilm aggregates were grouped into classes based on pixel size, from small aggregates (1 to 10/11 to 1,000) to medium (1,001 to 10,000/10,001 to 100,000) to large (>100,000). Shown is the contribution of each size class to the total aggregate area as determined by a percentage of the total pixel area. Asterisks denote a significant difference between size areas compared to day 3. Statistical analysis was done using Student’s t test.

