
Figure 4.
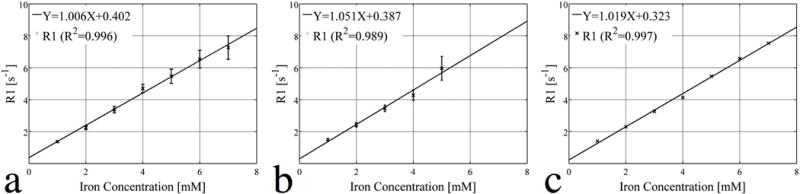
Concentrations of the different vials are linearly fitted to their R1 values estimated by the (a) VFA-SWIFT, (b) VFA-SPGR and (c) spectroscopic IR based methods. Notice that data from vials 6 and 7 were not included in the fitting due to the signal loss caused by fast T2* decay. The r1 values (slope) of the fits in (a), (b) and (c) are equal to 1.006, 1.051, and 1.019 s−1•mM−1. The R2 values of the three fits are equal to 0.996, 0.989 and 0.997.