
Figure 3.
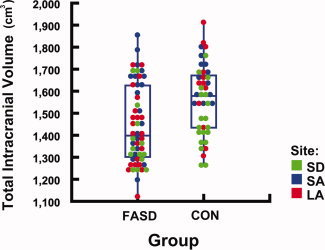
Reduced intracranial volume (ICV) in subjects with FASD Box plot illustrating the distribution of total ICV by group. Each circle represents one subject. Scan locations of subjects are coded with different colors. Across groups, subjects with FASD have significantly (P = 0.001) smaller ICV than controls.