
Figure 6.
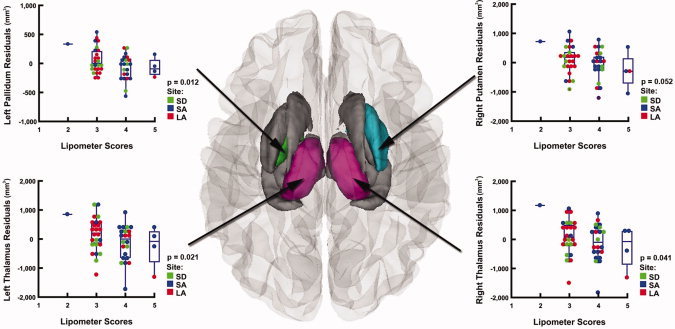
Relationships between brain volume reductions and philtrum lipometer scores after controlling for scan location, age, sex, and ICV in subjects with FASD Superior view of the brain, showing the regions in which more pronounced dysmorphology of the philtrum was associated with smaller subcortical volumes in the FASD group (n = 52). After controlling for site, age, sex, and ICV in multiple regression analyses, areas in gray represent regions where this relationship was no loner significant. Areas displayed in color represent regions where these results remained significant (P < 0.05, in the left pallidum and in the left and right thalamus), or retained a trend‐level of significance (P < 0.1, in the right putamen). Residual plots corresponding to each one of these regions are displayed on the side.