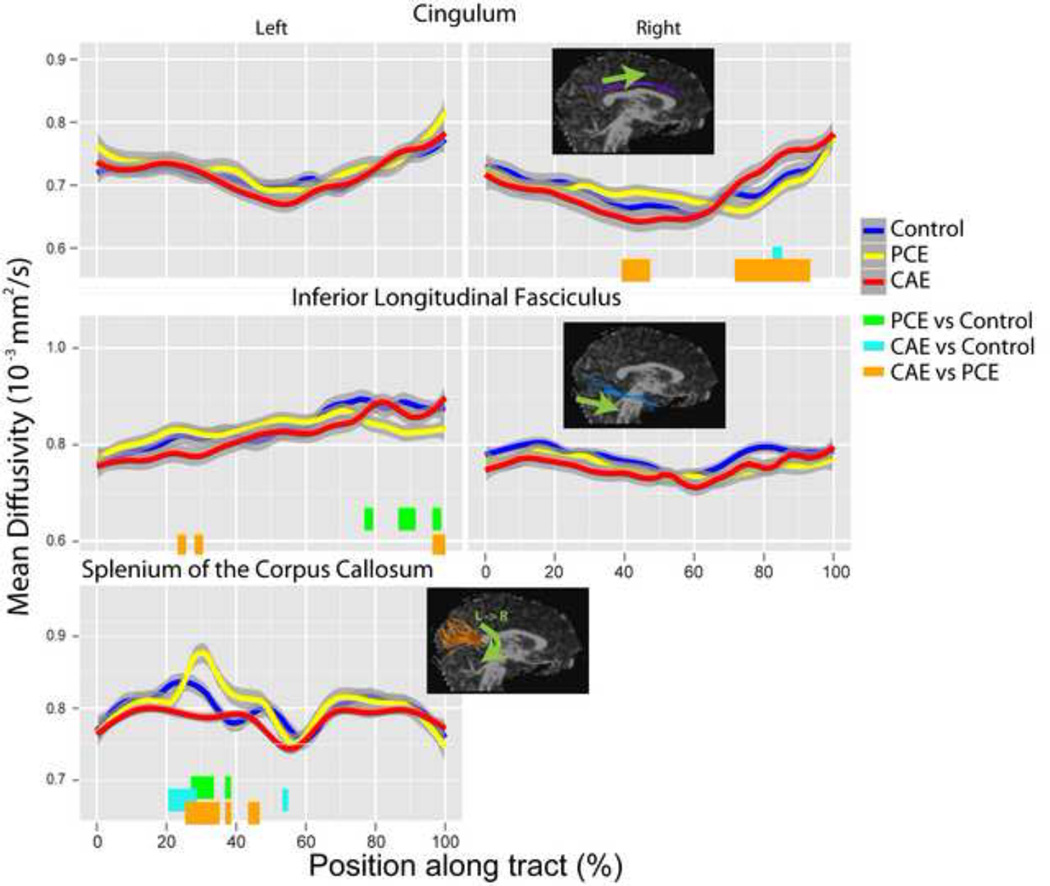
Figure 3.
Mean diffusivity (MD) values are shown along tracts for each group for tracts with significant group-point interaction terms. Significant group differences are indicated with colored bars at the bottom of each plot. No group differences were observed in the left cingulum or right inferior longitudinal fasciculus, but these are shown for comparison purposes. PCE=prenatal cocaine exposure; CAE=prenatal cocaine and alcohol exposure.

