
Figure 1.
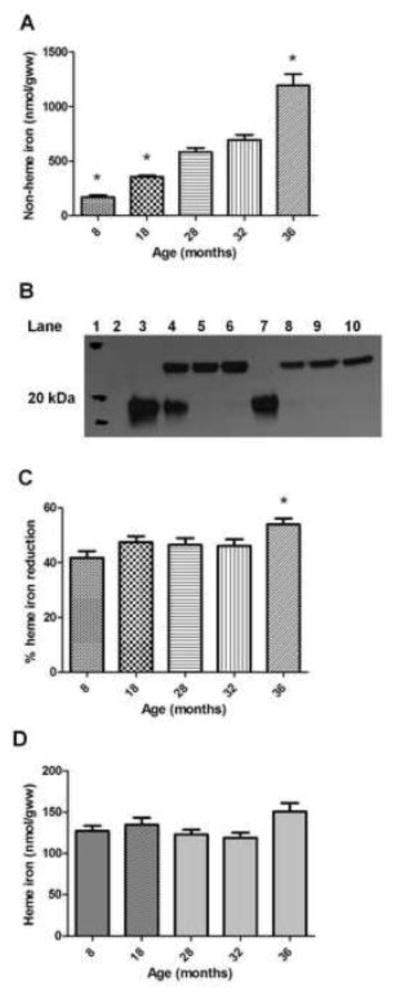
Plantaris non-heme and heme iron. A) Non-heme iron concentration expressed relative to grams of tissue wet weight (gww). *Different from all other groups (p<0.05); n=9–10 animals/group. B) Representative western blot illustrating 8-month (lanes 3–6; 0, 5, 10, 20 μL antibody, respectively) and 36-month (lanes 7–10; 0, 5, 10, 20 μL antibody, respectively) hemoglobin-β immunoprecipated plantaris muscle samples (lane 1=molecular weight marker; lane 2=no sample). Top bands (~23 kDa) illustrate IgG light chains and bottom bands (~18 kDa) illustrate hemoglobin-β. Total reaction volumes equal across samples. C) Percent heme-iron reduction in the samples following immunoprecipitation of hemoglobin-β. *Different from 8-month group (p<0.05); n=7–10/group. D) Heme iron concentration expressed relative to grams of tissue wet weight; n=7–10 animals/group. Values are mean±SEM.