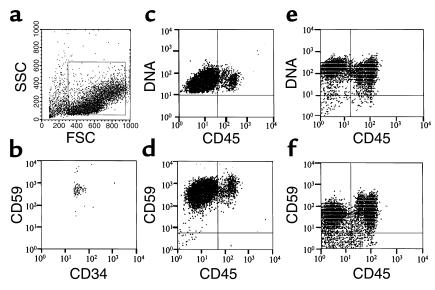
Figure 1.
Method of CD34+ cell collection and phenotype of CD34+ cell progeny from two healthy controls. (a and b) Gates were placed on forward scatter and side scatter (shown by the box in a) and CD34+ fluorescence. The purity of the sorted cells is shown in b. (c–f) After culturing, cells were stained for GPI-anchored CD59; CD45; and DNA in three-color analyses. The results for two healthy volunteers, N1 (c and e) and N2 (d and f) are shown.

