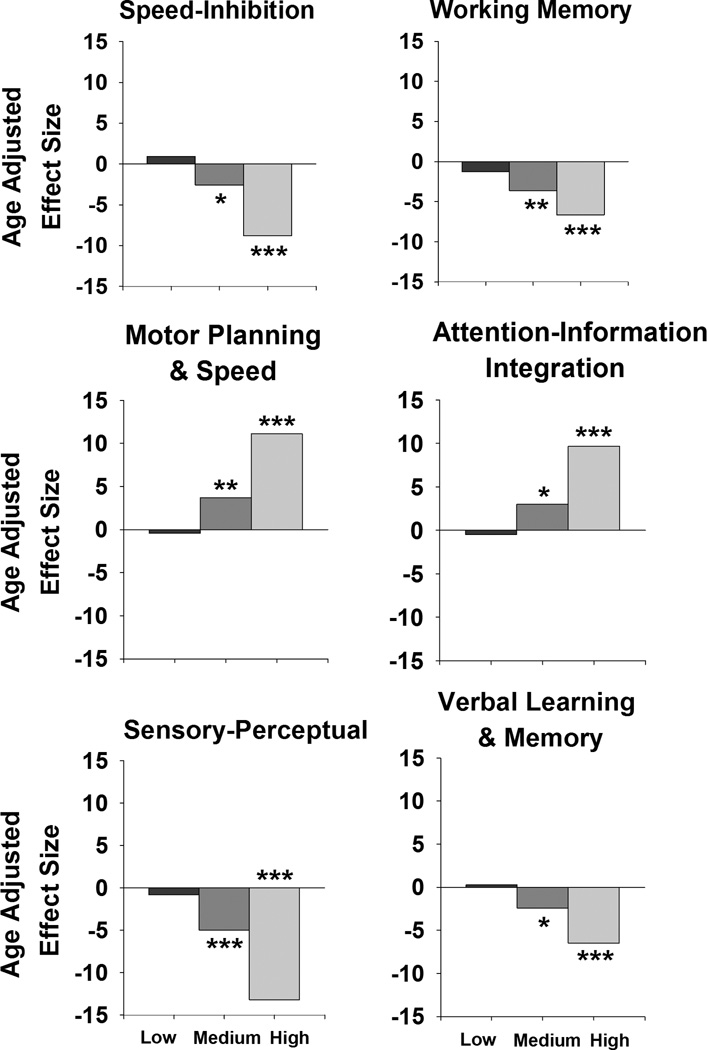
Figure 1.
Age adjusted effect sizes for the six factor scores in the low, medium, and high CAP groups. Standardized effect size = effect size/standard error of effect size. Asterisks denote the significance of pairwise comparisons between the control group and each CAP group where * = p<.02, ** = p<.001, and *** = p<.0001.

