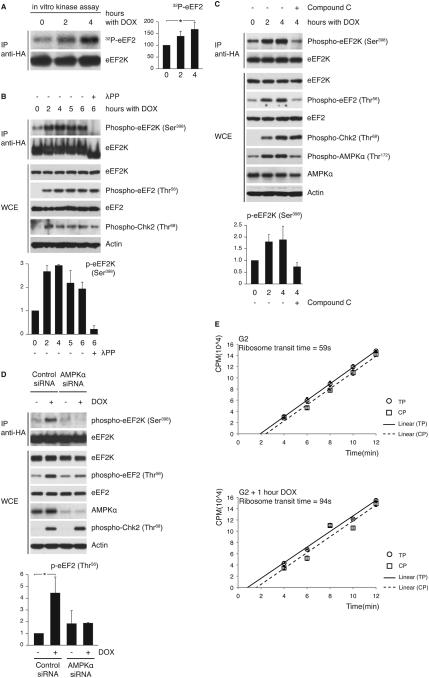
Figure 4. AMPK-mediated phosphorylation of eEF2K on Ser398 causes eEF2K activation in response to genotoxic stress.
(A) eEF2K was immunoprecipitated from doxorubicin-treated G2 U2OS cells and assayed for activity against in vitro translated eEF2. The graph shows the amount of phosphorylated eEF2 relative to time 0. *P<0.05 compared to time 0 by one-way ANOVA and Dunnett’s post-hoc test. (B) G2 U2OS cells were treated with doxorubicin for indicated times. One IP sample (λPP) was treated with λ-phosphatase prior to immunoblotting. (C and D) U2OS cells were treated with compound-C (C) or siRNA oligonucleotides targeting AMPKα (D). Graphs for (B) and (C) illustrate the amount of phospho-eEF2K(Ser398) normalized to eEF2K and relative to time 0. The graph in (D) shows abundance of phospho-eEF2(Thr56) normalized to eEF2 and relative to untreated control siRNA sample. *P<0.01 compared to all other samples by one-way ANOVA and Bonferroni’s post-hoc test. (E) Ribosome transit time for G2 cells and doxorubicin-treated G2 cells. [35S]methionine incorporation into total proteins (TP; circles) or into completed peptides released from ribosomes (CP; squares) is shown (CPM: counts per minute). Comparison of ribosome transit time for G2 and doxorubicin-treated cells by Student’s t-test gives P<0.005. Data represent at least three independent experiments.

