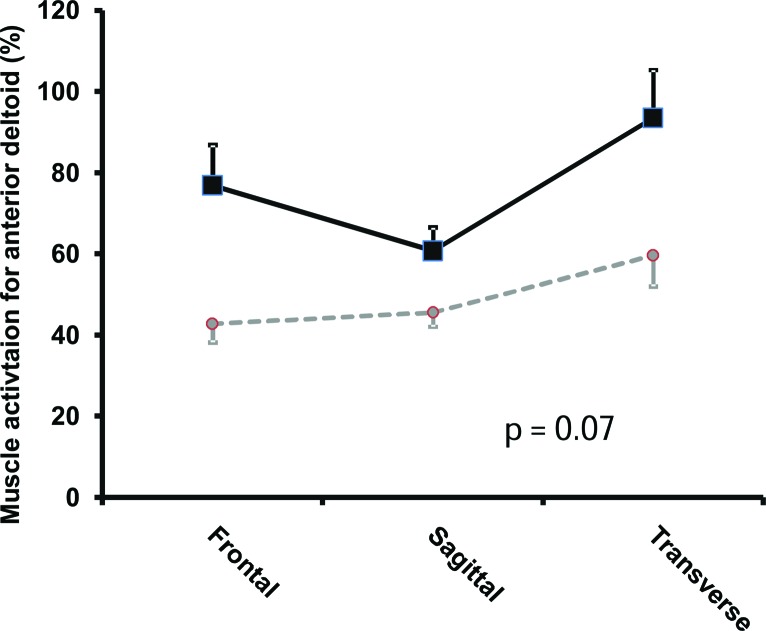
Figure 6.
Graph showing the activation of anterior deltoid with respect to planes and devices. There was a trend (p = 0.07) towards an interaction between the planes and the devices. Squares with full lines represent double oscillating devices (DOD) whereas circles with intermittent lines represent single oscillating devices.

