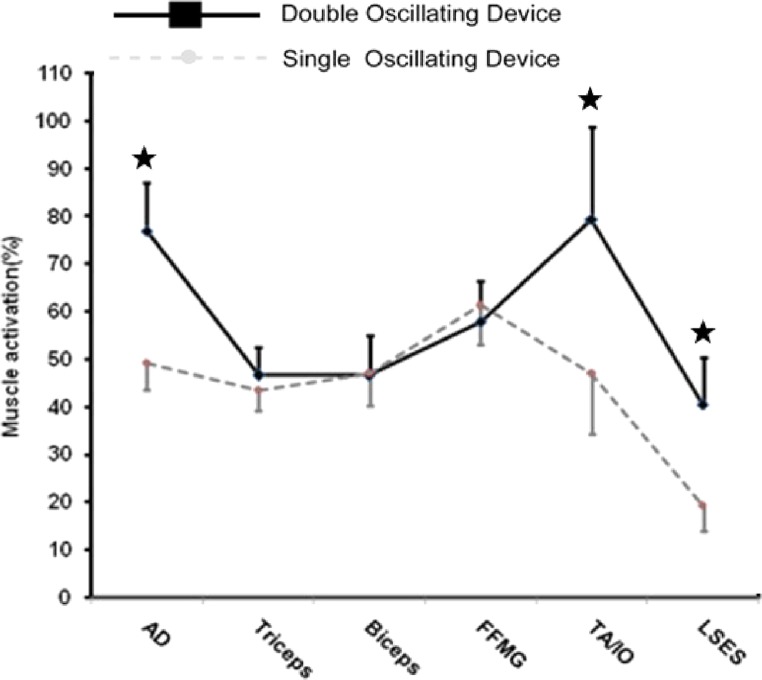
Figure 7.
Graph representing the individual amount of muscle activation with respect to devices (both DOD and SOD).
AD=anterior deltoid, FFMG=forearm flexor muscle group, TA/IO=ransversus abdominis/ internal oblique, LSES=lumbo-sacral erector spinae. Asterisks (*) indicate that significantly (p < 0.05) greater activation occurred with the DOD than with the SOD for the respective muscles. Squares with full lines represent double oscillating devices (DOD) whereas circles with intermittent lines represent single oscillating devices.

