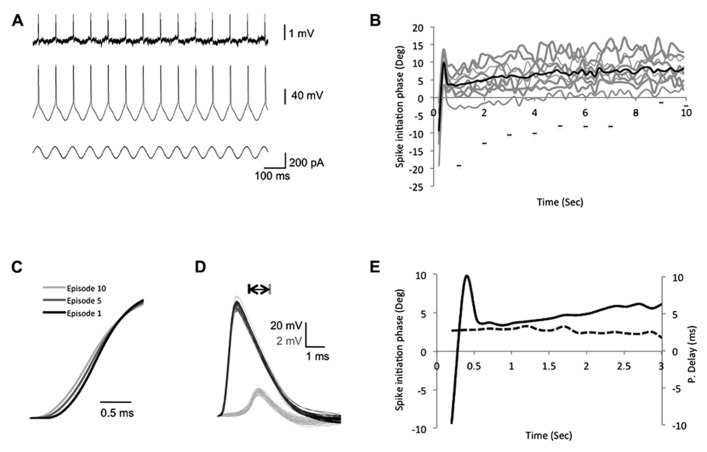
FIGURE 3.
Intrinsic plasticity inducing protocols modify the bAP initiation phase. (A) The experimental design depicting the recording traces from both soma and dendrites during the suprathreshold sinusoidal stimulus protocol, which consists of 10 episodes. In each episode a 10-s suprathreshold sinusoidal current was injected into the soma (bottom trace) at 7 Hz and elicits spikes in the soma (middle trace), which paired with the peak of each rising cycle and propagated to the dendrites (top trace). (B) A plot depicting the somatic spike-timing phase during SSS protocol. Gray – single episodes, black – average. The horizontal bars represent the first spike in each episode (from left to right, x-axis represents episode number), to show the shift of the first spike across episodes. (C) Expansion of the sample average spike rising slopes of the 1st, 5th, and 10th episodes recorded in the soma depict a decrease of the rising slope across episodes. (D) Expansion of action potentials recorded in the soma (black) and apical dendrite (gray, 350 μm from the soma, PV = 0.41 m/s) during one episode. Note the consistent shape and amplitude of spikes during one episode. Scale bar – horizontal 1 ms; vertical – 20 mV black traces and 2 mV gray traces. (E) Expansion of the first 3 s in (B). Solid line represents the average somatic spike-timing phase. Dashed line represents the average propagation delay time (values on the right ordinate in milliseconds), which did not correlate with the change in the spike initiation phase.

