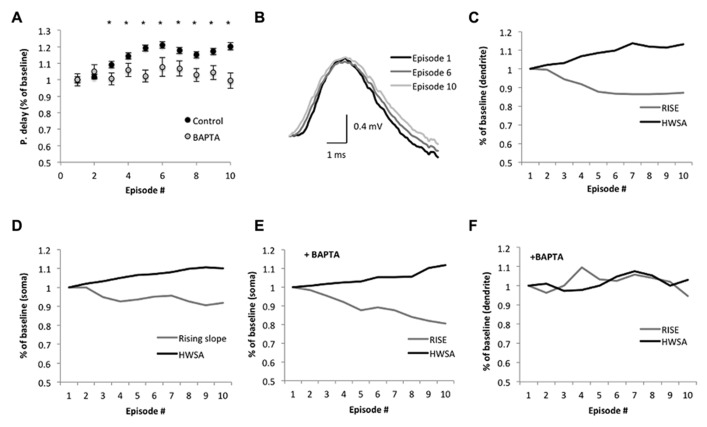
FIGURE 4.
Suprathreshold sinusoidal stimulus protocols modify spike backpropagation delays. (A) Average propagation delay (shown as % of baseline) during the SSS protocol. Each dot represents the average delay in the episode. The average delay in the first episode was used as baseline. Significant alterations from baseline were noticed from the third episode onward (*p < 0.005, two-tailed Student’s t-test). The calcium chelator BAPTA abolished the significant increase in propagation delay in the last seven episodes, implying a calcium dependence (n = 4, p > 0.3; two-tailed Student’s t-test). (B) Average bAP traces in the dendrite (250 μm from the soma, aligned to the peak) at the 1st, 6th, and 10th episode show the changes in the slope. Scale bar (1 ms; 0.4 mV). (C,F) The average rising slope (10–90%) and HWSA of the bAP recorded in the dendrite during SSS show decreases and increases, respectively, across episodes as a % of baseline, which determined as the average rising slope in the first episode. (D,E) Modifications of the spike waveform across episodes plotted as a change from baseline. Black – HWSA, gray – 10–90% rising slope. (F) The addition of BAPTA to the recording electrode modified the significant alterations in the spike waveform.

