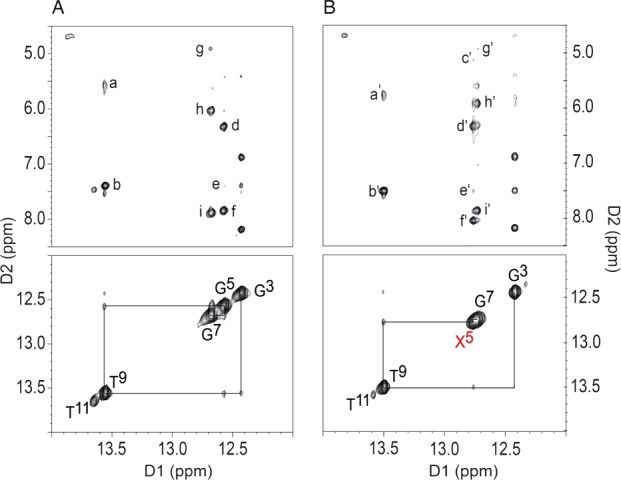
Figure 3.

Expanded plots from the 600 MHz NOESY spectra showing NOE connectivity of the guanine N1H and thymine N3H imino protons (lower panels) and the cytosine N4H and adenine N6H amino protons (upper panels). (A) The OL-1a duplex. The cross-peaks are assigned as: a, T9 N3H → A4N6H2; b, T9 N3H → A4 H2; c, G5 N1H → C8 H5; d, G5 N1H → C8N4H1; e, G5 N1H → A4 H2; f, G5 N1H → C8N4H2; g, G7 N1H → C6 H5; h, G7 N1H → C6N4H1; i, G7 N1H → C6N4H2. (B) The OL-1b duplex. The X5 imino resonance is shown in red. The cross-peaks are assigned as: a′, T9 N3H → A4N6H2; b′, T9 N3H → A4 H2; c′, X5 N1H → C8 H5; d′, X5 N1H → C8N4H1; e′, X5 N1H → A4 H2; f′, X5 N1H → C8N4H2; g′, G7 N1H → C6 H5; h′, G7 N1H → C6N4H1; i′, G7 N1H → C6N4H2. The spectra were collected at 5 °C.
