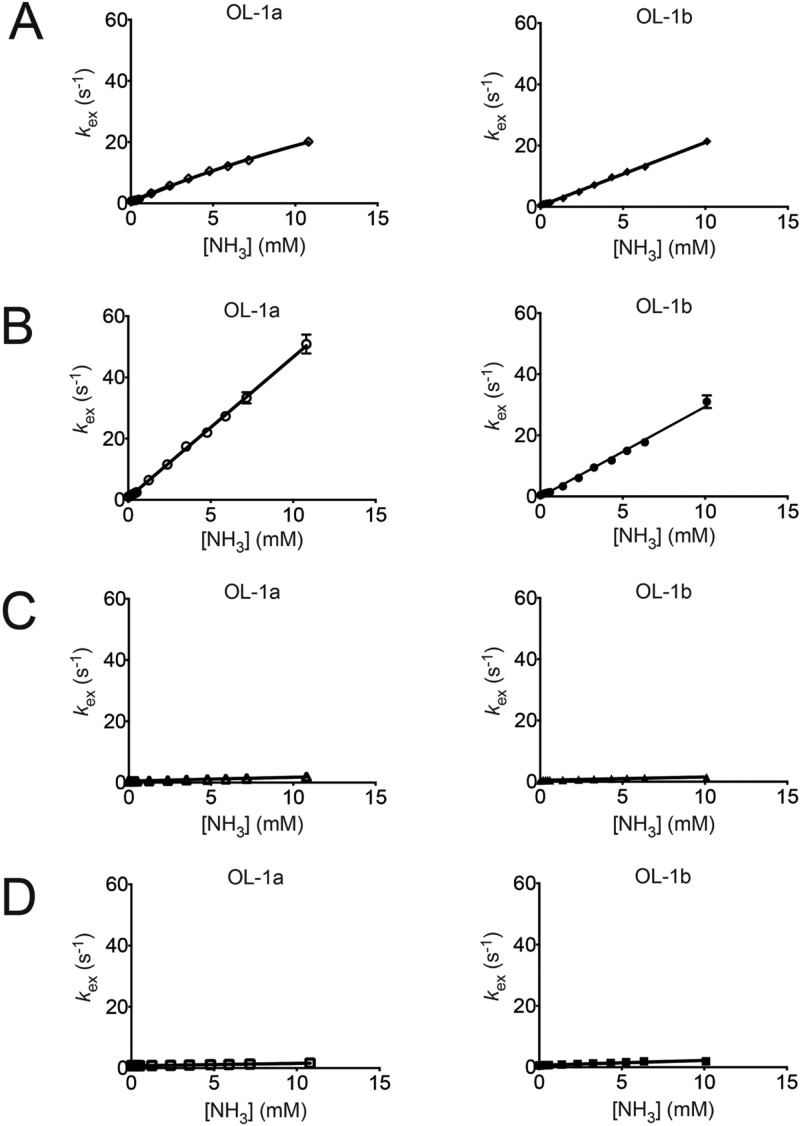
Figure 9.
Plots of imino proton exchange rates, kex, obtained by monitoring the transfer of magnetization from water as a function of added ammonia base catalyst. (A) The left panel shows base pair G3:C10 in the OL-1a duplex, and the right panel shows base pair G3:C10 in the OL-1b duplex. (B) The left panel shows base pair A4:T9 in the OL-1a duplex, and the right panel shows base pair A4:T9 in the OL-1b duplex. (C) The left panel shows base pair G5:C8 in the OL-1a duplex, and the right panel shows base pair X5:C8 in the OL-1b duplex. (D) The left panel shows base pair C6:G7 in the OL-1a duplex, and the right panel shows base pair C6:G7 in the OL-1b duplex.

