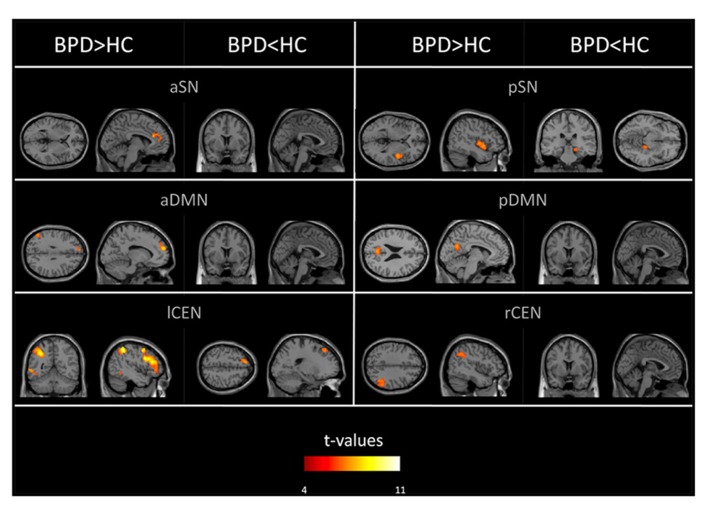
FIGURE 2.
Aberrant intrinsic functional connectivity within DMN, SN, and CEN (intra-iFC) of patients. SPMs of group differences in intra-iFC for the DMN, SN, and CEN (voxel-wise two-sample t-tests) controlled for antipsychotic medication. SPMs are thresholded at p < 0.05, FWE-corrected at cluster level and superimposed on a single subject high resolution T1 image. Color coding (red > yellow) represents t-values ranging from 4 to 11.

