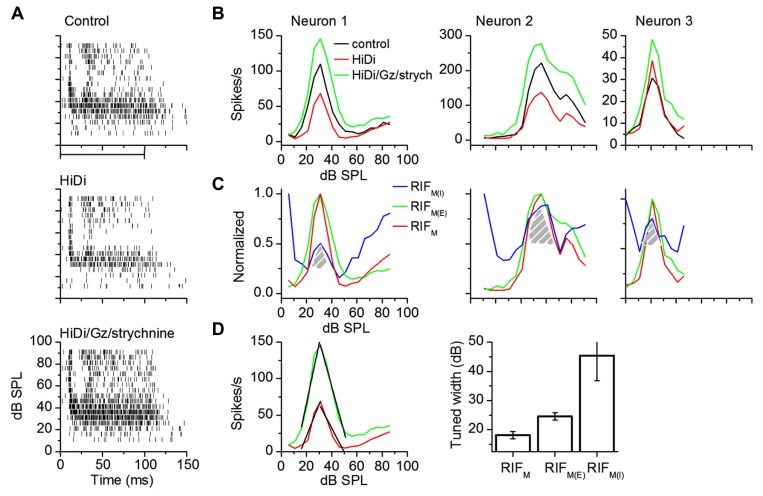
FIGURE 6.
Monosynaptic excitation and inhibition in intensity-tuned neurons. (A) Spike rasters in control (top); HiDi (middle); HiDi + Gz + strychnine (bottom). (B) RIFs for the three neurons. Left: the cell in (A); middle, right: two other cells. (C) Normalized RIFM, RIFM(E), and GainM(I) for the three cells in (B). GainM(I) changes the direction of its gain control with sound intensity. Hatched region: GainM(I) exhibits a “tuned” gain. (D) Left: linear fits (black lines) of the rising and falling limbs of RIFM(E) and RIFM for Neuron 1 in (B). Rising limb: RIFM, r2 = 0.90285; slope, 4.12821 spikes/s/dB SPL; RIFM(E); r2 = 0.92772; slope, 8.2253; falling limb: RIFM, r2 = 0.88935; slope, -3.30769; RIFM(E), r2 = 0.98401; slope, -6.3333. Right: population averages of tuned widths. Tuned widths were measured at half the peak height of normalized functions. 14 cells. Mean and SEM.

