
Figure 1.
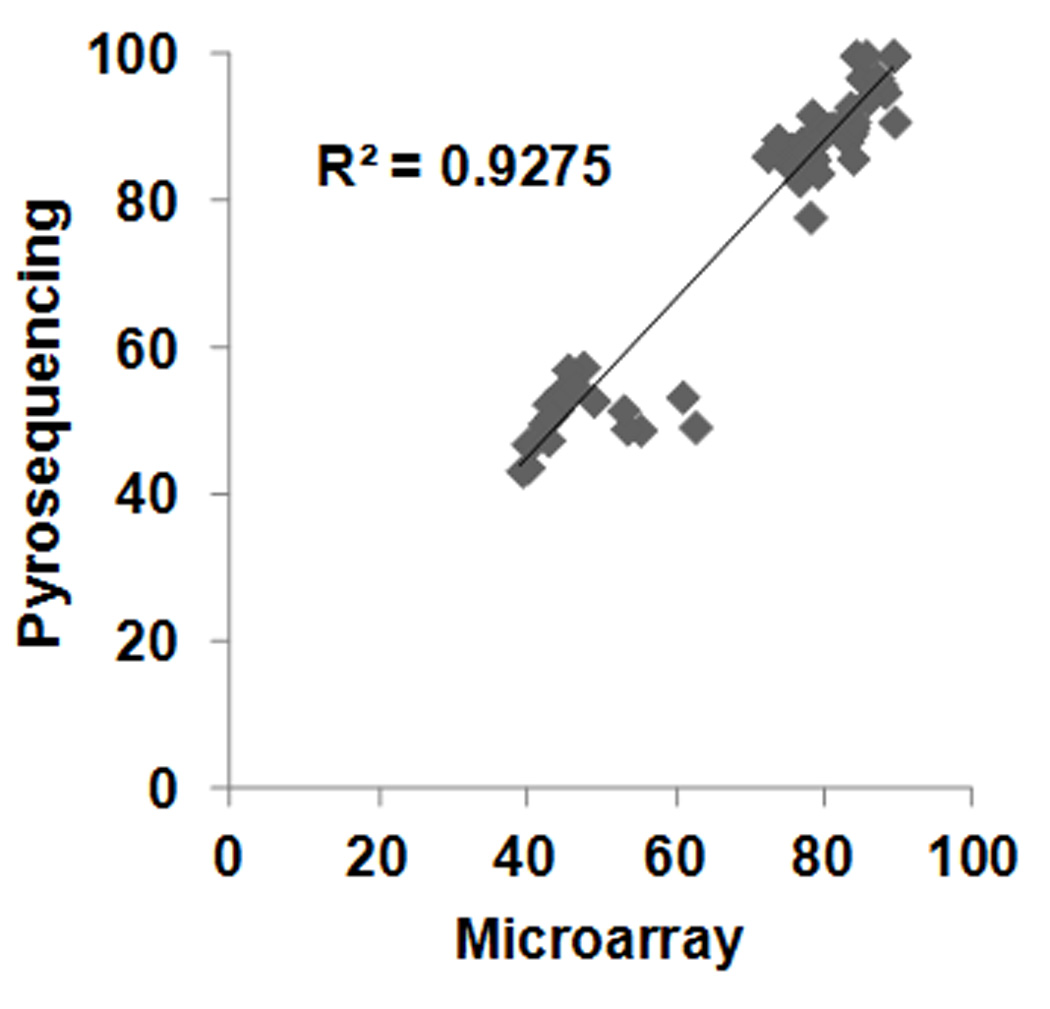
Scatter plot of methylation levels obtained by Infinium HumanMethylation450 Microarrays (Microarray) versus bisulfite pyrosequencing at the SCL6A9, FAM53B, and TEPP associated CpG sites. Significant correlation was observed. r=0.963; p<<0.00001