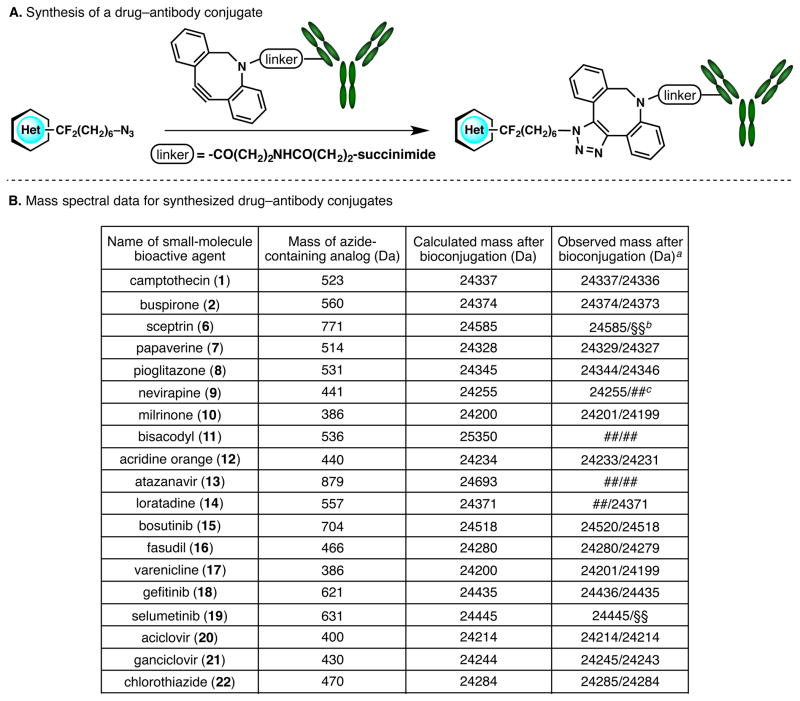
Figure 3.
A. Appending a monoclonal antibody to an azide-containing bioactive agent. B. Mass spectral data that verifies the formation of drug–antibody conjugates. aThe two indicated values refer to the mass spectral data arising from two different methods of conjugation (please see the Supporting Information for details); the slight differences in mass between the two methods are deconvolution artifacts. bThe symbol §§ indicates that the second method of bioconjugation was not conducted. cThe symbol ## indicates that the bioconjugation was unsuccessful.

