
Fig 1. MEF in human and mouse gliomas.
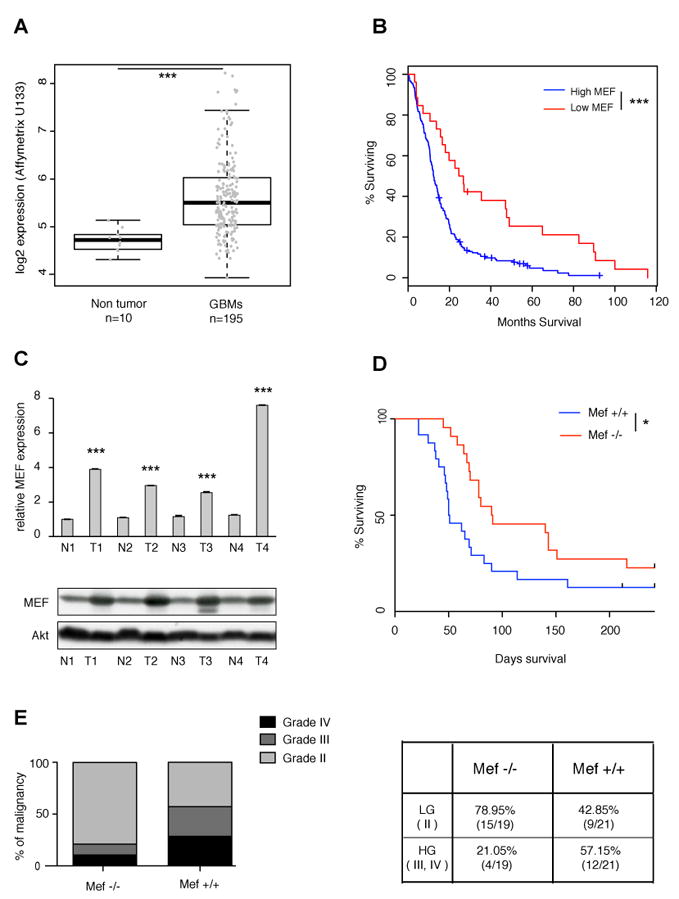
(A) MEF expression in the TCGA data set obtained from human GBM samples (n=195) and non tumor brain tissue (n=10) (***p=2.366e-09, Student’s t test). (B) Kaplan Meier survival curves of TCGA GBM patients: low level of MEF (calculated as less than one standard deviation from the mean of diploid tumors) significantly correlates with better overall survival (***log-rank p value p=0.000386). (C) Top panel: MEF mRNA level detected by RT PCR is higher in PDGF driven mouse GBMs (T) compared to normal tissue (N). Data are normalized to GAPDH expression. Results are presented as mean ± SD (***p<0.0001, Student’s t test); bottom panel: western blot showing that MEF protein level is higher in PDGF driven mouse GBMs compared to normal tissue. (D) Kaplan Meyer survival curves of PDGF gliomas generated in Ntva Mef+/+ vs. Mef-/- mice. MEF loss increases overall survival and reduces gliomagenesis (log-rank p value *p=0.02). (E) Left panel: mouse gliomas lacking MEF show significantly lower percentage of high-grade versus low-grade tumors (Fisher’s exact test *p=0.027); right panel: contingency table presenting the number of HG tumors vs. LG tumors in the two different genetic backgrounds. See also Fig S1.