
Fig 3. MEF promotes stem cell traits of both primary brain cultures and glioma cell lines.
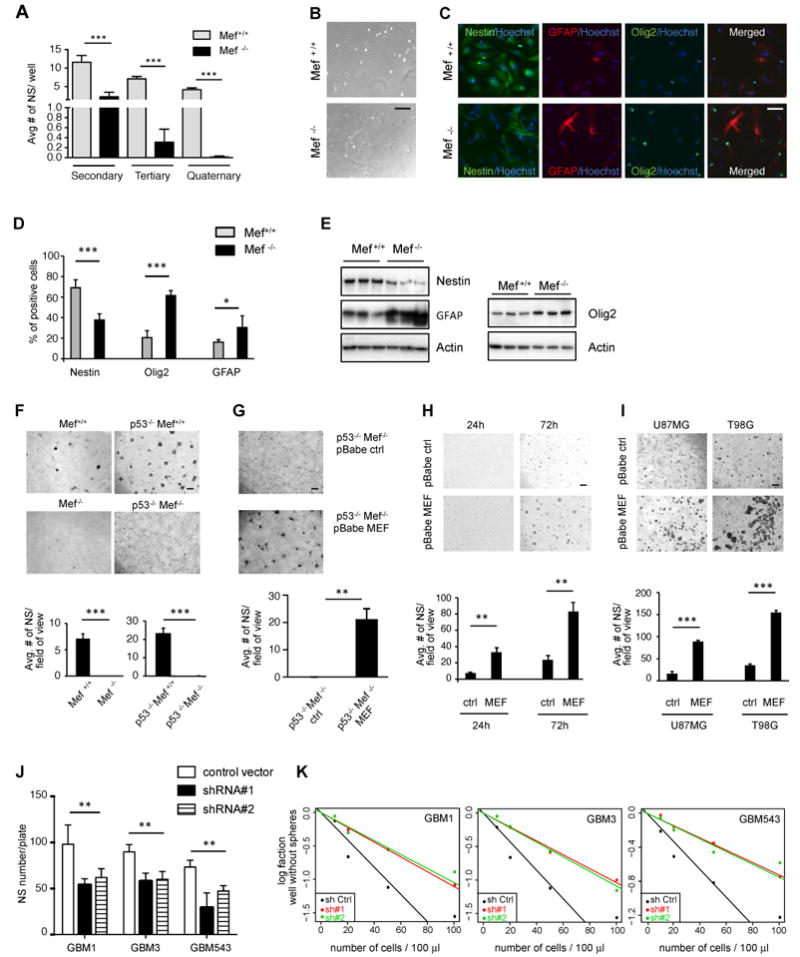
(A) Neurospheres isolated from newborn pups, with Mef+/+ and Mef-/- genetic background respectively: MEF loss led to impaired neurosphere formation after serial passages. (B) Phase contrast images showing morphological changes between Mef+/+ and Mef-/- brain cells grown in 5% serum, without bFGF and EGF, for 5 days to favor differentiation. (C and D) Immunofluorescence staining and quantification of Mef+/+ and Mef-/- brain cells grown in the above condition to favor differentiation. Positive staining is quantified as percentages of total Hoechst positive cells per image (10 fields of images were taken for each cell, derived from 4 Mef-/- and 4 Mef+/+ mouse brains); scale bars indicate 5μm. (E) Western blot comparing 3 Mef-/- vs to Mef+/+ brain cells: lack of MEF lead to decreased Nestin and increased Olig2 and GFAP protein levels. (F) Mef+/+, Mef-/-, p53-/-/Mef+/+ and p53-/-/Mef-/- primary brain cultures grown in neurosphere conditions. Scale bars indicate 100μm. (G) Re-expression of MEF in p53-/-Mef-/- cells rescues their ability to form neurospheres when cultured in neurosphere conditions. (H) Micrograph showing p53-/- primary brain cells transfected with pBabe-empty and pBabe-MEF retroviral vectors, cultured in neurosphere conditions. Bar graphs on the bottom show average neurosphere number per field of view. (I) MEF overexpressing human U87 and T98G cell lines, cultured in neurosphere conditions, form more neurospheres compared to control. Bar graphs on the bottom show average neurosphere number per field of view. (J) Graph bar showing decreased neurosphere formation after MEF knock down in patients-derived human primary GBMs (GBM1, 3 and 543). (K) Graph represent limiting dilution neurosphere assays in patients-derived human primary GBMs (GBM1, 3 and 543) infected with pGipz control vector and pGipz MEF sh RNAs #1 and #2. Results are presented as mean ± SD from a representative of three experiments performed in triplicate, unless otherwise specified. *p<0.05; **p<0.005; ***p<0.0001 (Student’s t test). See also Fig S3.