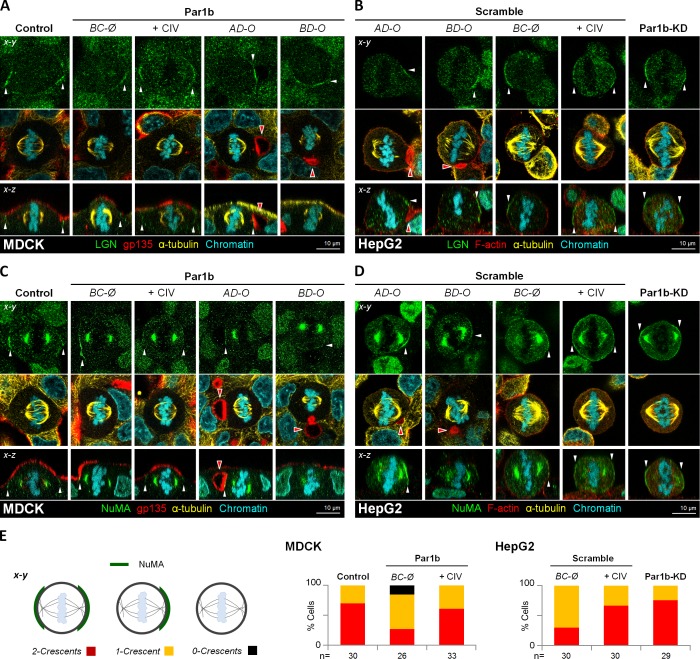
Figure 6.
Par1b alters cortical LGN–NuMA distribution in metaphase. Control, Par1b-expressing (A and C) or control (Scramble) and Par1b-depleted (Par1b-KD) HepG2 cells (B and D) plated on uncoated or collagen IV–coated (+CIV) coverslips were fixed and stained for LGN (A and B) or NuMA (C and D), gp135 or F-actin (MDCK and HepG2, respectively), α-tubulin, and chromatin. The cortical pattern (E, left: 2 crescents, red; 1 Crescent, yellow; or 0 crescents, black) of the NuMA distribution in cells was plotted (E, right panels). See the schematics in Fig. 4 A for the nomenclature. Red arrowheads, BC-like lumina; white arrowheads, cortical distribution of NuMA (A and B) or LGN (C and D).

