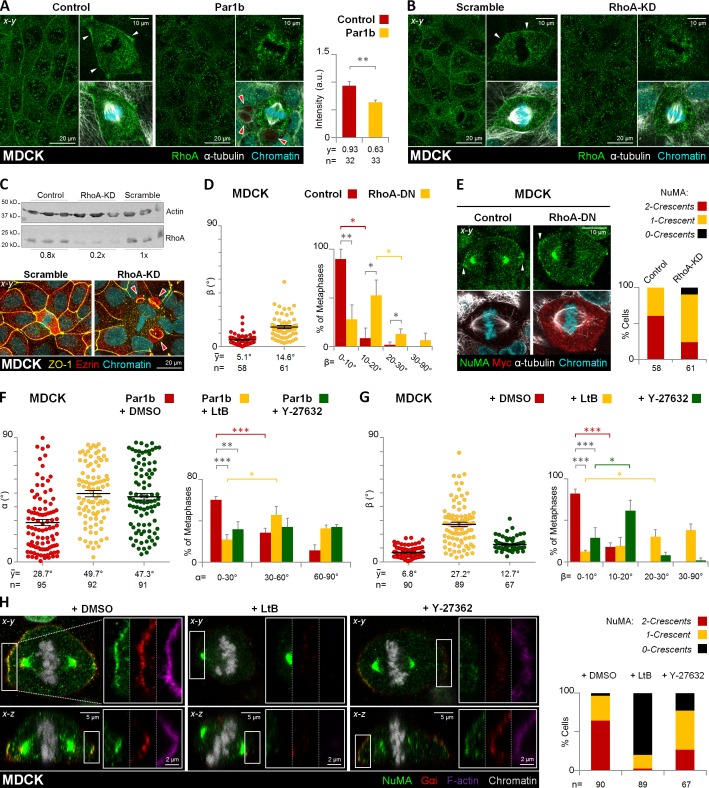
Figure 7.
RhoA/RhoK inhibition alters mitotic spindle orientation and cortical LGN–NuMA distribution in metaphase. Control, Par1b-expressing (A) or control (Scramble) and RhoA-depleted (B, RhoA-KD) MDCK cells were fixed and stained for RhoA, α-tubulin, and chromatin. The mean fluorescence intensity of the cortical RhoA was quantified (A, right). (C) Endogenous RhoA levels in control, scrambled, and RhoA-KD MDCK cells (top) and immunostaining of scrambled and RhoA-KD cells for ZO-1 and ezrin (bottom). Note the presence of lateral lumina in the RhoA-depleted cells (red arrowheads). Control and RhoA-DN expressing MDCK cells (D and E), were fixed and stained for NuMA, myc, α-tubulin, and chromatin. Par1b (F) and control MDCK cells (G and H) were treated with DMSO (0.001% vol/vol), microfilament-depolymerizing agent, latrunculin B (LtB, 2 µM/45 min), or Rho-kinase inhibitor Y-27632 (50 µM/45 min). Cells were fixed and stained for NuMA, Gαi, F-actin, and chromatin (H). The α (F) and β angle (G) were quantified. The percentage of cells with β angles in the 10–20° category for Y-27632 or in the 20–30° category for LtB was significantly higher (61.4 ± 12.6% and 30.3 ± 8.5%, respectively) than that of cells with β angles in the 0–10° category (29.0 ± 12.2% and 12.3 ± 1.7%, respectively). The cortical pattern (2 crescents, red; 1 crescent, yellow; or 0 crescents, black) of the NuMA distribution in cells was plotted (E and H, right panels). Red arrowheads, BC-like lumina; white arrowheads, cortical distribution of RhoA (A and B) or NuMA (E). Error bars indicate ± SEM (dot graphics) or + SD (bar graphics).*, P ≤ 0.05; **, P ≤ 0.01; ***, P ≤ 0.001.

