Figure 8.
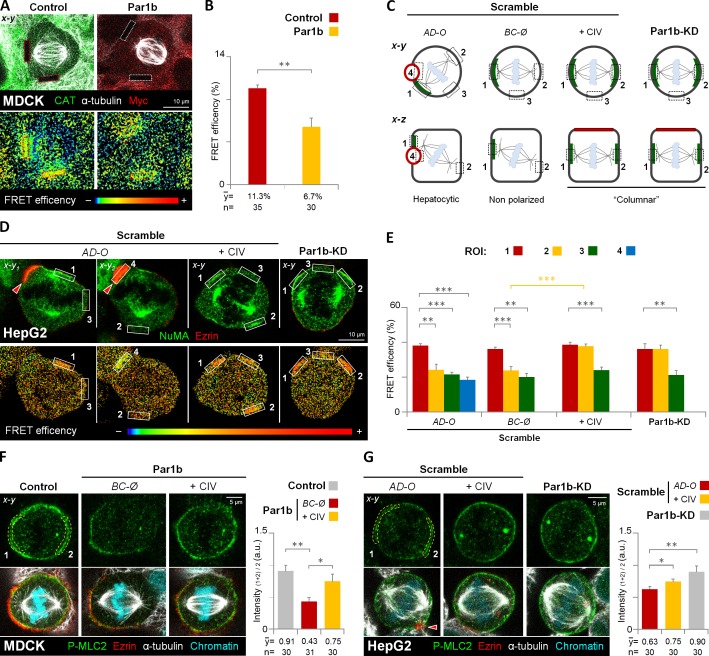
Par1b-mediated ECM signaling inhibits RhoA activity in metaphase cells. (A and B) MDCK cells expressing a RhoA FRET biosensor were transduced with adenoviruses expressing either CAT (Control) or Par1b-myc (Par1b). Cells were fixed and stained with α-tubulin and either CAT or myc antibodies (A, top). The FRET efficiency from acceptor to donor species in the cell cortex (A, dashed rectangles in bottom panel) was quantified (B). (C) Schematic x-y and x-z views of the regions of interest (ROIs) for RhoA activity measurements in HepG2 cells. The ROIs correspond to the cortical area adjacent to the left (1) and right (2) centrosome, a cortical region perpendicular to the spindle pole axis (3), and the lateral lumina membrane (4). Green labeling represents the NuMA localization. (D and E) Control (Scramble) and Par1b-depleted HepG2 cells (Par1b-KD) expressing the RhoA FRET biosensor were fixed and stained with NuMA and ezrin antibodies (D, top). The FRET efficiency (D, bottom) from acceptor to donor species was quantified (E, n = 30 cells for either AD-O, BC-Ø, +CIV, and Par1b-KD). (F and G) Control, Par1b-expressing (F) or control (Scramble) and Par1b-depleted HepG2 cells (G) were fixed and stained for the phosphorylated form of myosin light chain 2 (P-MLC2), ezrin, α-tubulin, and chromatin. The mean fluorescence intensity of the cortical P-MLC2 was quantified (right panels). Red arrowheads, BC-like lumina. a.u., arbitrary unit. Error bars indicate ± SD. *, P ≤ 0.05; **, P ≤ 0.01; ***, P ≤ 0.001.

