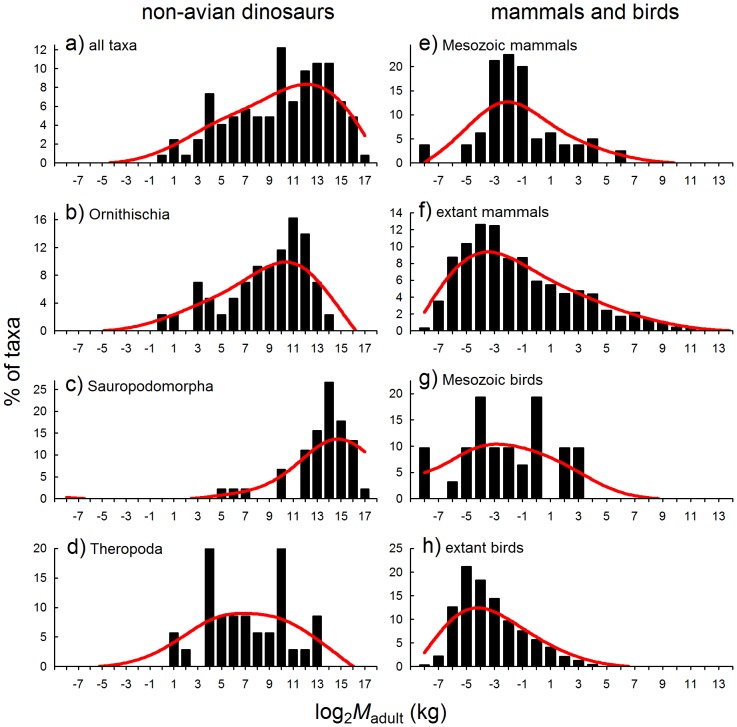
Figure 1. Body mass-species richness (M-S) distributions, represented on a log2-scale, of extinct (non-avian) dinosaurs, in comparison with distributions of mammals and birds from the Mesozoic and present-day distributions.
Data for Mesozoic vertebrates compiled in [4], see references therein for primary sources, and data for extant mammals and birds are from [29]–[31]. Red curves are fitted visually to aid interpretation.

