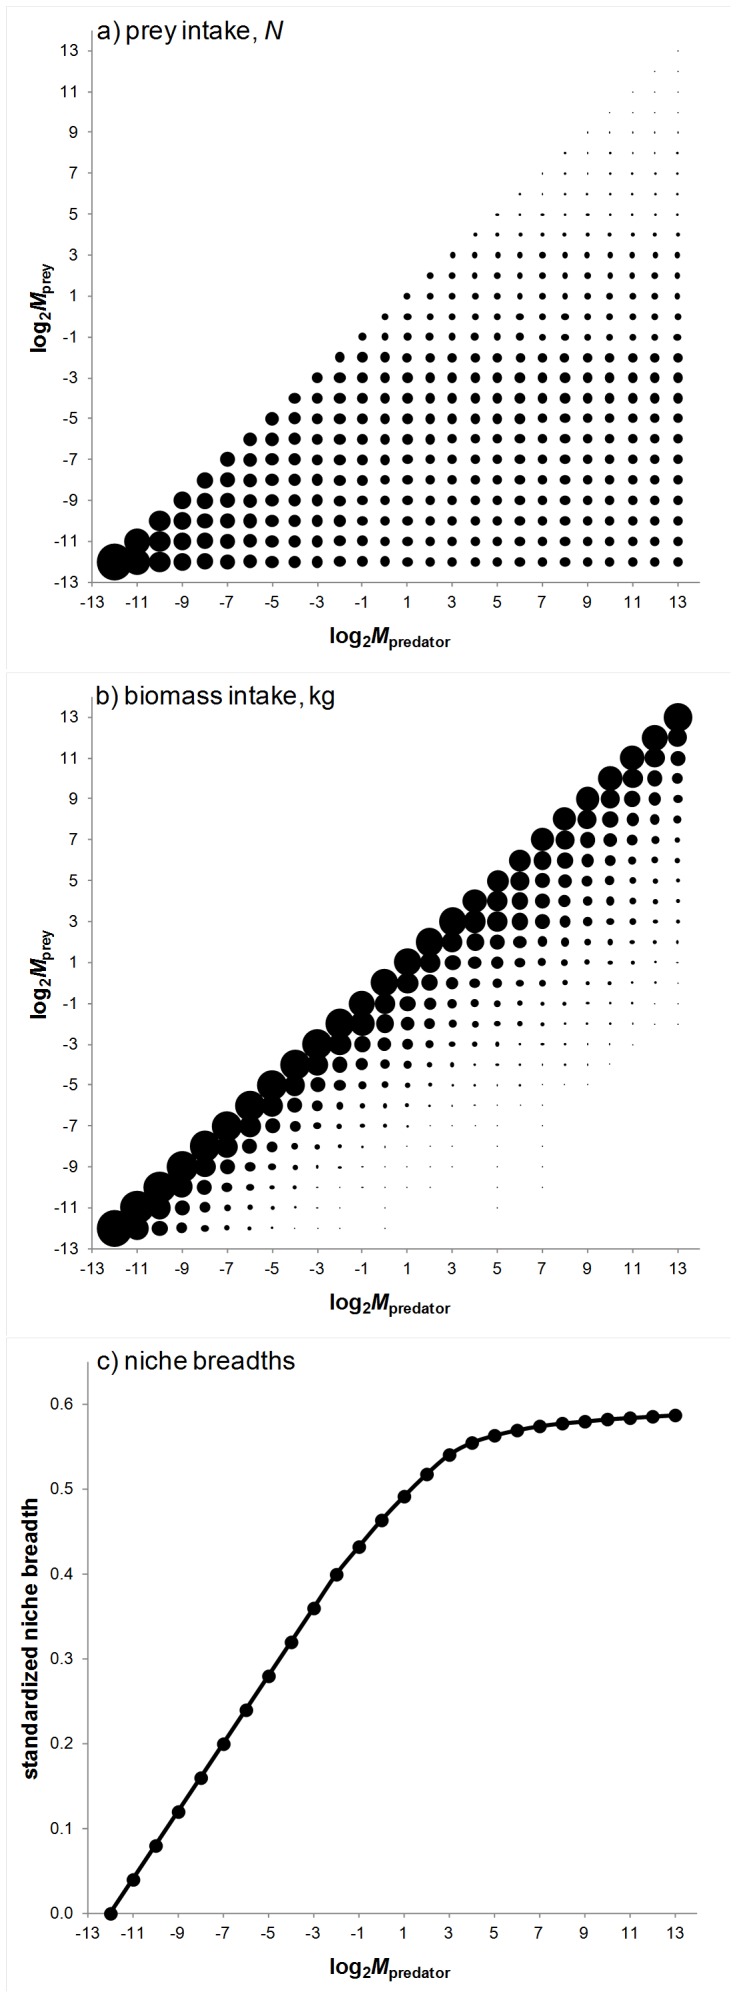
Figure 4. Prey partitioning amongst different-sized predators that arises in models where no prey partitioning was assumed a priori.

In a) and b) bubbles represent relative contributions of different-sized prey to predator diets, based on numbers or total biomass (kg) consumed, respectively; for c) niche breadths were calculated based relative numbers of prey consumed per size class.
