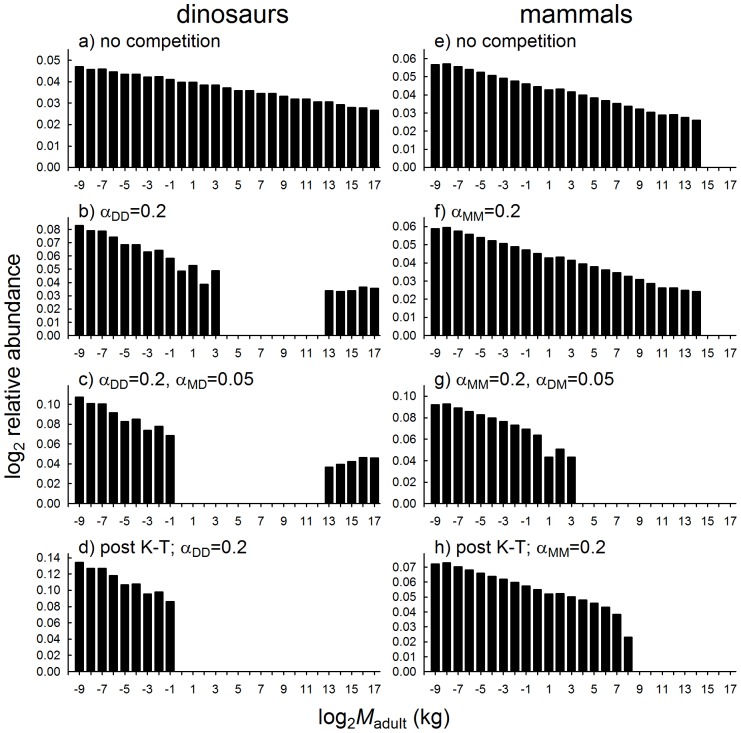
Figure 5. Outcomes of the size-specific competition model, comparing outcomes for M-S distributions of dinosaur (with a higher number of size-specific niche overlaps due to their more complex ontogenetic histories) and mammal communities.
Competition co-efficients (α) represent the proportion of density-dependent mortalities that occur, due to competition between dinosaurs (subscript DD), between mammals (MM), from mammals on dinosaurs (MD), and from dinosaurs on mammals (DM). Post K-T extinction scenarios were simulated by setting initial conditions to exclude all individuals above 25 kg.

