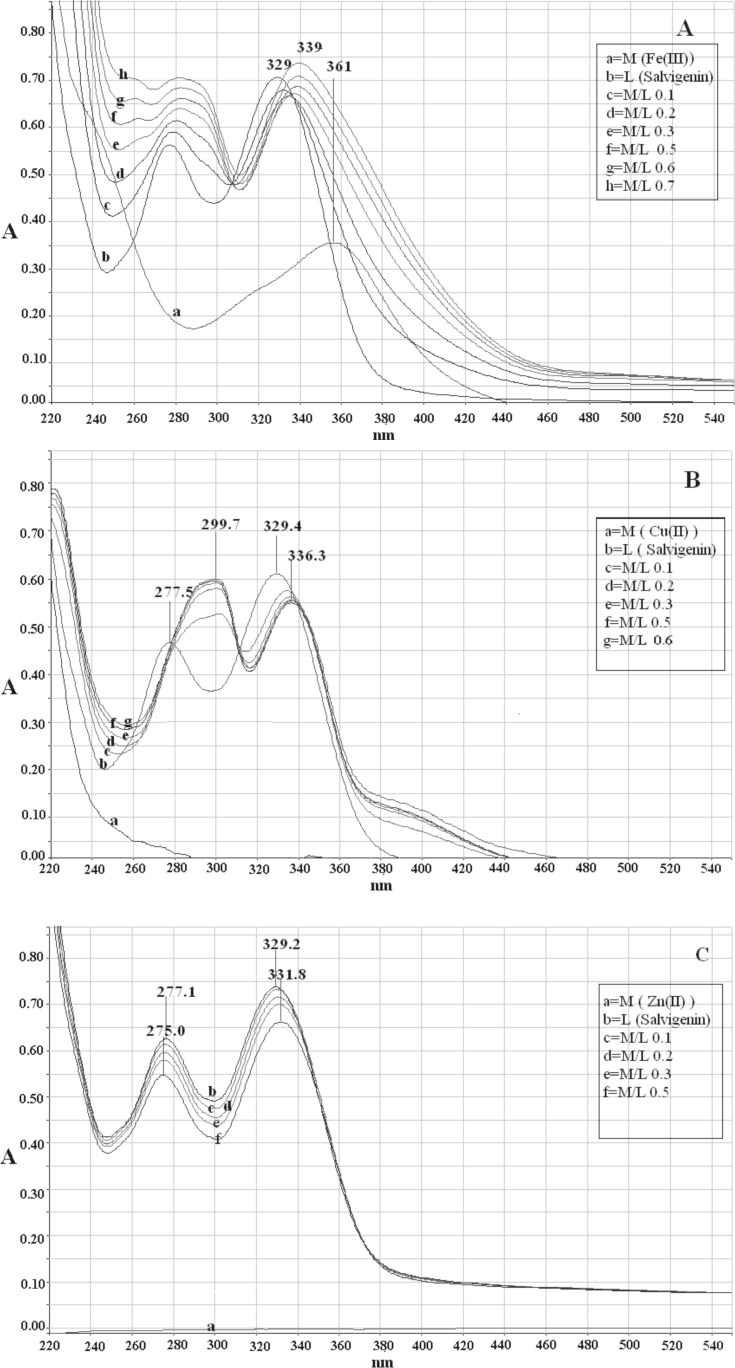
Figure 2.
Electronic absorption spectra of (a) salvigenin (1.0 × 10⁻⁴ M) in methanolic solution in absence and presence of Fe(III) without pH control, (b) salvigenin (.0 × 10-4 M) in methanolic solution in absence and presence of Cu(II) without pH control, (c) salvigenin (.0 × 10-4 M) in methanolic solution in absence and presence of Zn(II) without pH control

