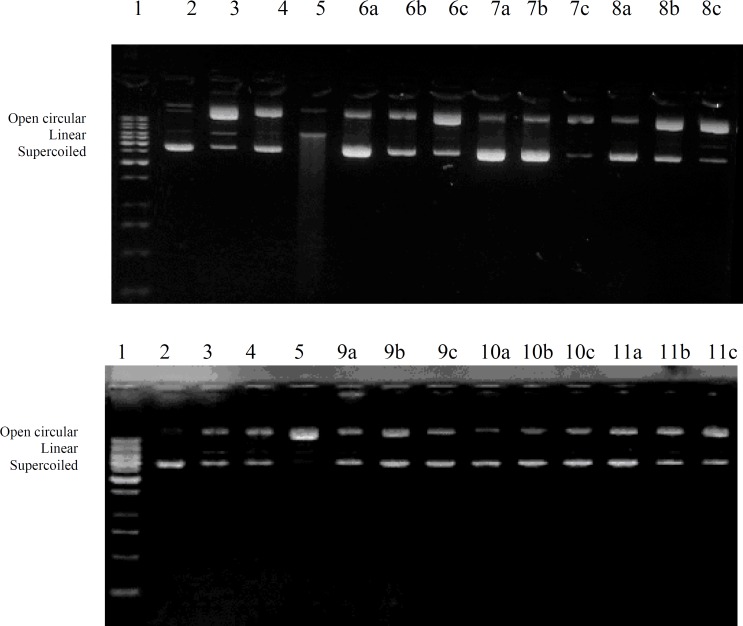
Figure 1.
DNA protection affect of crude extract and different fractions of E. wallichii roots.1 = 1Kb DNA Ladder, 2 = Plasmid DNA (pBR 322), 3 = Plasmid DNA treated with FeSO4, 4 = Plasmid DNA treated with H2O2, 5 = Plasmid DNA treated with FeSO4 and H2O2, a= 1000 μg/mL, b = 100 μg/mL, c = 10 μg/mL, 6 = CME, 7 = NHF, 8 = NBF, 9 = CHF, 10 = EAF, 11 = AQF in which a,b,c shows three replicates for each test sample

