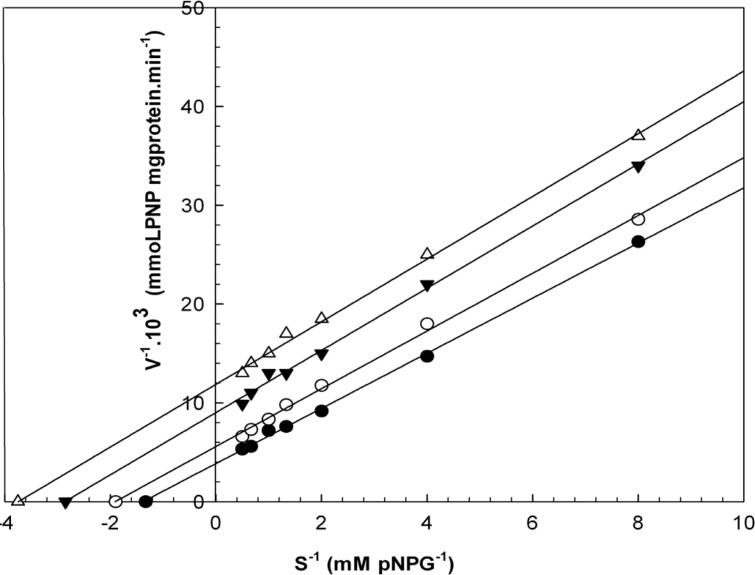
Figure 4.
Lineweaver-Burk plots derived from the inhibition of α-glucosidase by 1-(S)-α-pinene. α-glucosidase was treated with each stated concentration of pNPG (0.125-2 mM) in the absence and presence of 1-(S)-α-pinene. The concentrations of 1-(S)-α-pinene were: (●) no inhibitor; (○) 0.250 μL/mL; (▼) 0.580 μL/mL; and (Δ) 1.160 μL/mL. The enzyme reaction was performed by incubating the mixture at 37ºC for 30 min.

