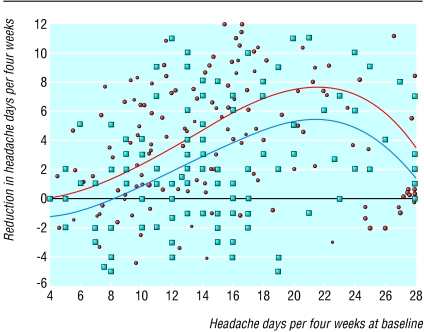
Fig 2.
Frequency of headache at baseline and after treatment. Red dots are actual values for patients in the acupuncture group; blue squares are for controls. The straight line represents no change: observations above the line improved. The curved lines are regression lines (upper red line for acupuncture, lower blue line for controls) that can be used as predictions. Some outliers have been removed

