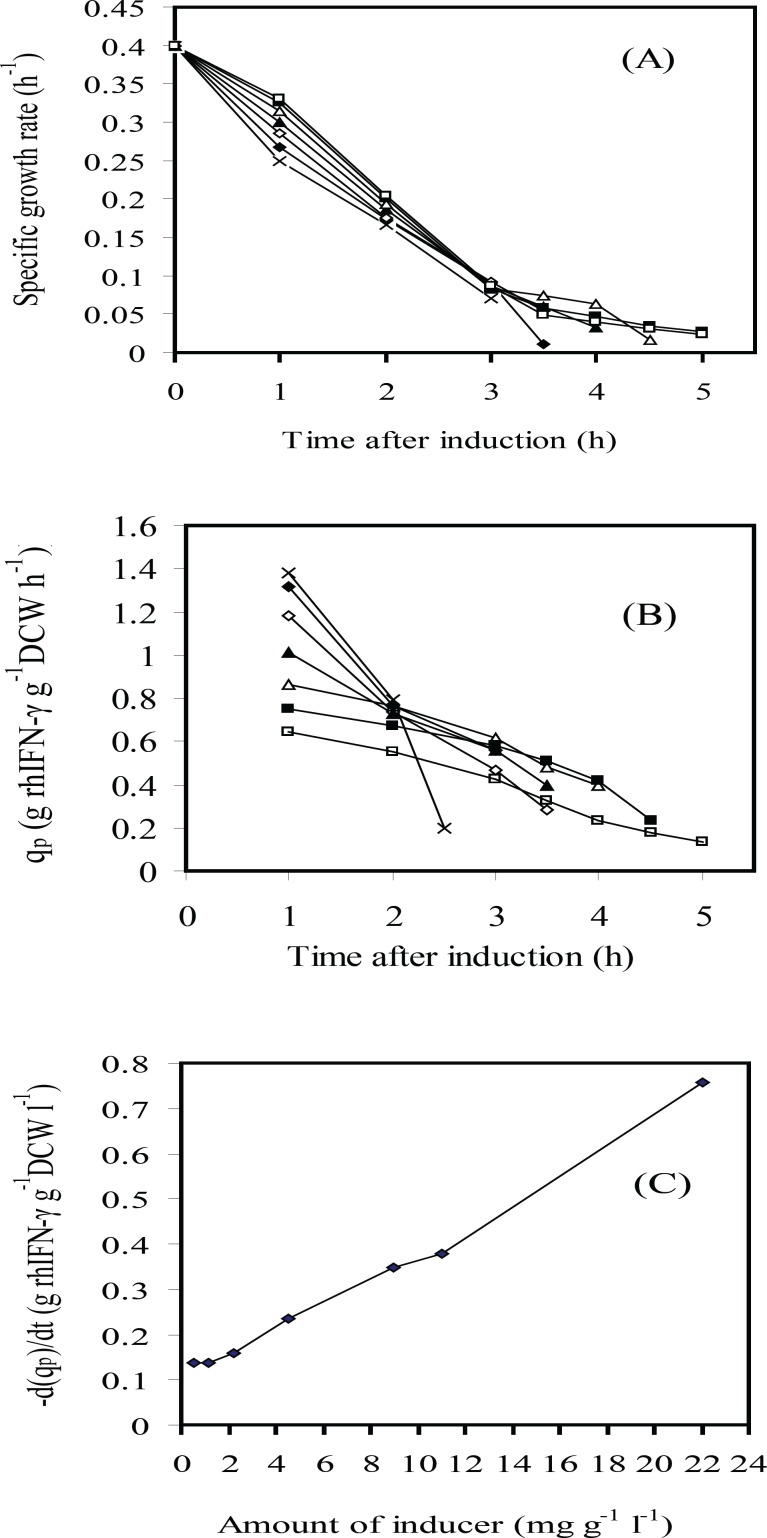
Figure 3.
Time courses of several variables after induction: (A) specific growth rate (μ); (B) rhIFN-γ production rate (qp) and (C) rhIFN-γ production rate variation d(qp)/dt vs. IPTG concentration (g L-1 g-1 IPTG per DCW): 22(×); 11(♦); 9(◊); 4.5 (▲); 2.25(Δ); 1.13(■); 0.565(□)at fed-batch cultures of E.coli BL21 (DE3) (pET3a-ifnγ).

